
A First Course in Probability (10th Edition)
10th Edition
ISBN: 9780134753119
Author: Sheldon Ross
Publisher: PEARSON
expand_more
expand_more
format_list_bulleted
Related questions
Concept explainers
Question
This is a question on normal distribution . Please provide a detailed explanation on this. Thanks in advance!
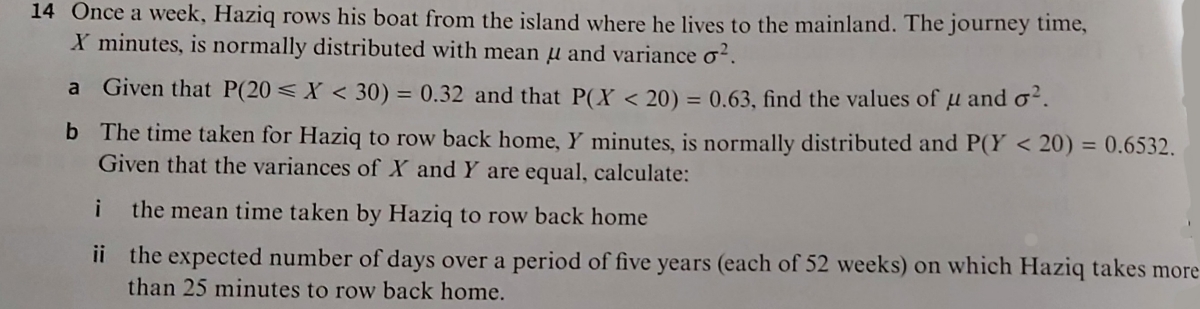

Transcribed Image Text:14 Once a week, Haziq rows his boat from the island where he lives to the mainland. The journey time,
X minutes, is normally distributed with mean u and variance o?.
a Given that P(20 < X < 30) = 0.32 and that P(X < 20) = 0.63, find the values of µ and oʻ.
b The time taken for Haziq to row back home, Y minutes, is normally distributed and P(Y < 20) = 0.6532.
Given that the variances of X and Y are equal, calculate:
i
the mean time taken by Haziq to row back home
ii the expected number of days over a period of five years (each of 52 weeks) on which Haziq takes more
than 25 minutes to row back home.
Expert Solution
This question has been solved!
Explore an expertly crafted, step-by-step solution for a thorough understanding of key concepts.

This is a popular solution

Trending nowThis is a popular solution!

Step by stepSolved in 2 steps

Knowledge Booster


Learn more about
Need a deep-dive on the concept behind this application? Look no further. Learn more about this topic, probability and related others by exploring similar questions and additional content below.Similar questions
- isn't it should use the normal table to find z value?arrow_forwardIVIT IVUIES PRACTICE ANOTHER Allen's hummingbird (Selasphorus sasin) has been studied by zoologist Bill Alther.t Suppose a small group of 13 Allen's hummingbirds has been under study In Arizona. The average weight for these birds is x = 3.15 grams. Based on previous studies, we can assume that the weights of Allen's hummingbirds have a normal distribution, with a - 0.34 gram. When finding an 80% confidence interval, what is the critical value for confidence level? (Give your answer to two decimal places.) 2 = 1.282 (a) Find an 80% confidence interval for the average weights of Allen's hummingbirds in the study region. What is the margin of error? (Round your answers to two decimal places.) lower limit 3.03 upper limit 3.27 margin of error 0.12 (b) What conditions are necessary for your calculations? (Select all that apply.) O normal distribution of weights o is unknown V o is known uniform distribution of weights n is large (c) Interpret your results in the context of this problem. The…arrow_forwardPlease explainarrow_forward
- Let's assume that the height of adult women in the United States follows a normal distribution with mean = 64.5 inches and sd = 3.1 inches. What proportion of women is shorter than 5'8" (68 inches)? Round your z to two decimal places, use the Z table, and keep all 4 decimals from the table.arrow_forwardThanks!arrow_forwardAccording to the data, the middle 60% of women will be between 62 and 66 inches tall. Explain how we would arrive at such a conclusion using normal distribution. You are encouraged to upload a picture to support your explanation. Heights of men and women in the U.S. are normally distributed. Recent information shows: Adult men heights: p= 69.6 inches with o = 3 inches. Adult women heights: p = 64.1 inches with o = 2.7 inches. Lab based on a lab pulled from: http://nc-stats.weebly.com/ T T T F Paragı : Arial : 5 (18p :E- E- T--arrow_forward
- What percent of the total population is found between the mean and the z-score given? (Use the standard normal distribution table and enter your answer to two decimal places.) z = 3.55 Please explain step by step.arrow_forwardPlease helparrow_forwardi dont understand how to get the answer to this questionarrow_forward
- Exam scores have a normal distribution, with Mean of 70 and Standard deviation of 10. Bob’s score was 80. Find and interpret his standard score.arrow_forwardState three examples where similar averages are associated with very different distributions Go deeper with one, and discuss how that might work in more detail.arrow_forwardDescribe the characteristics of the "normal distribution". Name the two parameters (two numerical descriptive measures) used in a normal distribution.arrow_forward
arrow_back_ios
SEE MORE QUESTIONS
arrow_forward_ios
Recommended textbooks for you
- A First Course in Probability (10th Edition)ProbabilityISBN:9780134753119Author:Sheldon RossPublisher:PEARSON

A First Course in Probability (10th Edition)
Probability
ISBN:9780134753119
Author:Sheldon Ross
Publisher:PEARSON