ENGR.ECONOMIC ANALYSIS
14th Edition
ISBN: 9780190931919
Author: NEWNAN
Publisher: Oxford University Press
expand_more
expand_more
format_list_bulleted
Question

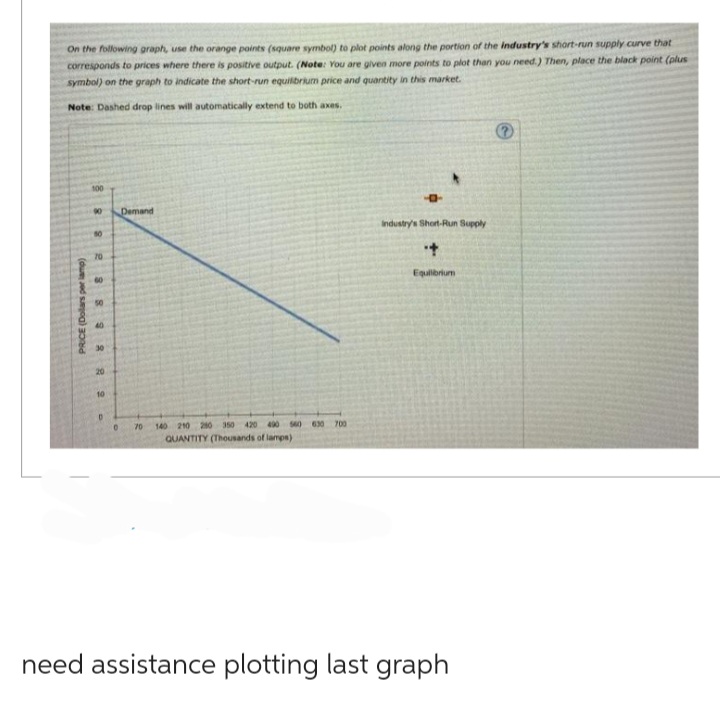
Transcribed Image Text:On the following graph, use the orange points (square symbol) to plot points along the portion of the industry's short-run supply curve that
corresponds to prices where there is positive output. (Note: You are given more points to plot than you need.) Then, place the black point (plus
symbol) on the graph to indicate the short-run equilibrium price and quantity in this market.
Note: Dashed drop lines will automatically extend to both axes.
8 8 8 8 8
100
PRICE (Dollars per lamp)
8 8 8
50
30
20
10
D
0
Demand
70 140 210 280 350 420 490 560
QUANTITY (Thousands of lamps)
630 700
P
industry's Short-Run Supply
+
Equilibrium
need assistance plotting last graph

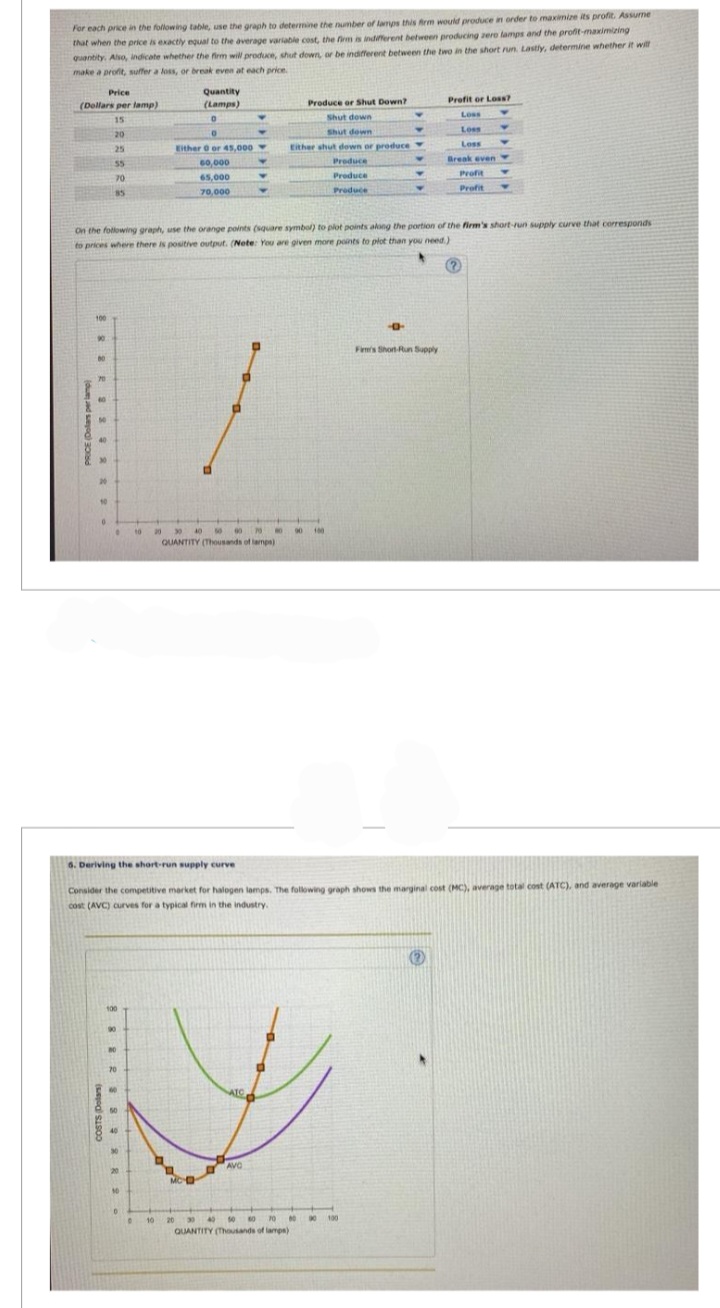
Transcribed Image Text:For each price in the following table, use the graph to determine the number of lamps this firm would produce in order to maximize its profit. Assume
that when the price is exactly equal to the average variable cost, the firm is indifferent between producing zero lamps and the profit-maximizing
quantity. Also, indicate whether the firm will produce, shut down, or be indifferent between the two in the short run. Lastly, determine whether it will
make a profit, suffer a loss, or break even at each price.
Price
(Dollars per lamp)
15
20
PRICE (Dollars per lamp
80
RS232
70
26
25
55
70
85
10
588 288 8
COSTS (Dolars)
20
On the following graph, use the orange points (square symbol) to plot points along the portion of the firm's short-run supply curve that corresponds
to prices where there is positive output. (Note: You are given more points to plot than you need.)
(?
10
0
10
D
Quantity
(Lamps)
0
0
Either 0 or 45,000
10
60,000
65,000
70,000
MC-D
20
D
20 30 40 50 60 75 NO
QUANTITY (Thousands of lamps)
Y
D
Y
6. Deriving the short-run supply curve
Consider the competitive market for halogen lamps. The following graph shows the marginal cost (MC), average total cost (ATC), and average variable
cost (AVC) curves for a typical firm in the industry.
ATC
♥
AVC
Produce or Shut Down?
Shut down
Shut down
Either shut down or produce
Produce
Produce
Produce
90 100
Y
50 60
70
00
30 40
QUANTITY (Thousands of lamps)
Y
00100
Profit or Loss?
Loss
Loss
Loss
--0-
Firm's Short-Run Supply
Y
Break even Y
Profit
Profit
Y
Expert Solution
This question has been solved!
Explore an expertly crafted, step-by-step solution for a thorough understanding of key concepts.
This is a popular solution
Trending nowThis is a popular solution!
Step by stepSolved in 3 steps with 3 images

Knowledge Booster
Learn more about
Need a deep-dive on the concept behind this application? Look no further. Learn more about this topic, economics and related others by exploring similar questions and additional content below.Similar questions
- Homework (Ch 09) 1. The supply curve in the very short run The following graph shows the annual demand for tortilla chip consumption, which is initially in long-run equilibrium at point D. Suppose that tortilla chips are sold in a perfectly competitive market, and tastes shift away from tortilla chips so that demand shifts leftward from D₁ to D₂. Use the purple line (diamond symbol) to illustrate the supply curve in the very short run. Make sure the line passes through two of the starred points on the graph. PRICE (Dollars per bag) 10 9 0 1 2 C D A B D₂ 3 4 5 6 7 8 QUANTITY (Millions of bags per year) 9 D. 10 Short-Run Supply Curve ?arrow_forwardPlease correct answer and don't use hend raitingarrow_forwardExplain how the following events may affect the profit rate for a U.S. firm and industry (be sure to define your measure(s) of the profit rate) :Consider both the immediate impact and the possible long run implications: (1) across firms within an industry; (2) across industries and (3) across nations please long and mindful answers that covers all three categories. j) Removal of all subsidies to the U.S. agriculture sector k) Reduction in the federal tax rate on profit incomearrow_forward
- Assume that the cost data in the following table are for a purely competitive producer: Average Average Average Total Variable Marginal Cost Total Fixed Product Cost Cost Cost 1 $60.00 $45.00 $105.00 $ 45.00 30.00 42.50 72.50 40.00 3 20.00 40.00 60.00 35.00 4 15.00 37.50 52.50 30.00 12.00 37.00 49.00 35.00 6. 10.00 37.50 47.50 40.00 7 8.57 38.57 47.14 45.00 7.50 40.63 48.13 55.00 9. 6.67 43.33 50.00 65.00 10 6.00 46.50 52.50 75.00 Instructions: If you are entering any negative numbers be sure to include a negative sign (-) in front of those numbers. Select "Not applicable" and enter a value of "0" for output if the firm does not produce. a. At a product price of $57.00 (i) Will this firm produce in the short run? (Click to select) V (ii) If it is preferable to produce, what will be the profit-maximizing or loss-minimizing output? |(Click to select V output = units per firm (iii) What economic profit or loss will the firm realize per unit of output? |(Click to select v per unit = $ b.…arrow_forwardQ27arrow_forwardThe following graph shows the market for annual tortilla chip consumption, which is initially in long-run equilibrium at point D. After the change in tastes and the rightward shift in demand, the market moves to point in the short run and then to point in the long run. On the following graph, use the purple line (diamond symbol) to plot the long-run market supply curve for tortilla chips, making sure that it goes through two of the points A, B, C, or D. PRICE (Dollars per bag 10 9 8 2 1 D 0 1 True B D₁ O False 23 C S 10²4 NO 2 3 4 5 7 8 QUANTITY (Milions of bags per year) According to the graph, the tortilla chip market is an example of 10 Long-Run Supply True or False: The average cost at the cost-minimizing level of output is lower for the new marginal firm than it was for the marginal firm before the change in demand. industry.arrow_forward
- Illustrate to the right, a graph showing a company being profitable in a competitive market in the Long Run selling its product at Market Price (MP*) based on its Average Variable Cost (AVC) and Average Total Cost (ATC) and Marginal Cost (MC). Identify each key point on the graph. Observe the Short - Run Loss information illustrated in the graph to the right. With respect to Price (P*"), Average Variable Cost (AVC), Average Total Cost (ATC), Marginal Revenue (MR), and Marginal Cost (MC), what assumption would you make if the firm was selling its product at P What would happen if this were to continue in the long run? Is there a Shut Down point? ** ? Notice that MR = Parrow_forwardThis problem continues from the previous one. On the graph the supply in the Rest of the World has shifted from Sstart to S2 and the market in the Rest of the World has moved to a new short run equilibrium at B. The price of Good A is P1 in the U.S. and P2 in the Rest of the World. Which answer choices are correct from the image bellow?arrow_forwardConsider the perfectly competitive spice market. At the equilibrium price, the elasticity of market supply is 2.65 and the elasticity of demand is 0.40. Spice is a normal good. An increase in incomes cause the market PRICE of spices to rise by 3%. What is the percentage change in market QUANTITY? Notes: Enter a number only, do not include the % sign. If it decreases, include a negative sign before your number. For example, if it is a 15.675% decrease, enter -15.68 not -0.15. If quantity decreases include a negative sign.arrow_forward
- Operation managementarrow_forwardFarmer Johnson producers Eggs in a perfectly competitive egg market. The short run cost curves are displayed below. $4.00 MC $3.50 ATC AVC $3.00 $2.50 $2.00 $1.50 $1.00 $0.50 $0 20 40 60 80 100 120 140 160 Dozens of Eggs Price of Eggsarrow_forwardqD = 100 – 0.5p, qS = 2p – 20 What is the price elasticity of supply? Is the situation modeled here more likely to be reflecting a short- or long-run equilibrium? Why?arrow_forward
arrow_back_ios
SEE MORE QUESTIONS
arrow_forward_ios
Recommended textbooks for you

 Principles of Economics (12th Edition)EconomicsISBN:9780134078779Author:Karl E. Case, Ray C. Fair, Sharon E. OsterPublisher:PEARSON
 Engineering Economy (17th Edition)EconomicsISBN:9780134870069Author:William G. Sullivan, Elin M. Wicks, C. Patrick KoellingPublisher:PEARSON
 Principles of Economics (MindTap Course List)EconomicsISBN:9781305585126Author:N. Gregory MankiwPublisher:Cengage Learning
 Managerial Economics: A Problem Solving ApproachEconomicsISBN:9781337106665Author:Luke M. Froeb, Brian T. McCann, Michael R. Ward, Mike ShorPublisher:Cengage Learning
 Managerial Economics & Business Strategy (Mcgraw-...EconomicsISBN:9781259290619Author:Michael Baye, Jeff PrincePublisher:McGraw-Hill Education


Principles of Economics (12th Edition)
Economics
ISBN:9780134078779
Author:Karl E. Case, Ray C. Fair, Sharon E. Oster
Publisher:PEARSON

Engineering Economy (17th Edition)
Economics
ISBN:9780134870069
Author:William G. Sullivan, Elin M. Wicks, C. Patrick Koelling
Publisher:PEARSON

Principles of Economics (MindTap Course List)
Economics
ISBN:9781305585126
Author:N. Gregory Mankiw
Publisher:Cengage Learning

Managerial Economics: A Problem Solving Approach
Economics
ISBN:9781337106665
Author:Luke M. Froeb, Brian T. McCann, Michael R. Ward, Mike Shor
Publisher:Cengage Learning

Managerial Economics & Business Strategy (Mcgraw-...
Economics
ISBN:9781259290619
Author:Michael Baye, Jeff Prince
Publisher:McGraw-Hill Education