MATLAB: An Introduction with Applications
6th Edition
ISBN: 9781119256830
Author: Amos Gilat
Publisher: John Wiley & Sons Inc
expand_more
expand_more
format_list_bulleted
Question
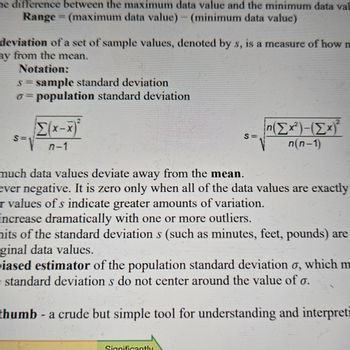
Use one of these two formulas below:

Transcribed Image Text:on Homework - Google Chrome
verHomework.aspx?homeworkId=682079573&questionld-7&flushed=false&cid=7924785¢erwin-yes
Os Fall 2024
res of Variation Homework
←
Question 9, 3.2.26-T
Part 2 of 7
。
X
Jahna Taylor 09/01/24 7:06 PM
?
HW Score: 83.86%, 8.39 of 10 points
Points: 0.1 of 1
Save
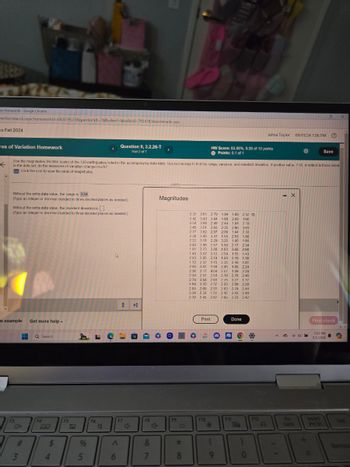
Use the magnitudes (Richter scale) of the 120 earthquakes listed in the accompanying data table. Use technology to find the range, variance, and standard deviation. If another value, 7.50, is added to those listed
in the data set, do the measures of variation change much?
Click the icon to view the table of magnitudes.
Without the extra data value, the range is 3.54
(Type an integer or decimal rounded to three decimal places as needed.)
Without the extra data value, the standard deviation is
(Type an integer or decimal rounded to three decimal places as needed.).
n example Get more help
F3
Search
10+
3
F4
BQ
4
$
F5
95
F6
♡
Magnitudes
3.32 2.81 2.79 1.04 1.69 2.52
2.42 3.43 3.04 1.60 2.88 1.60
2.54 3.98 2.49 2.44 1.84 2.19
2.45 3.01 2.93 2.35 2.00 3.01
2.77 3.82 2.97 2.09 184 233
2.38 3.45 3.41 1.55 2.53 1.50
2.22 3.11 2.29 3.25 1.95 1.93
2.40 2.96 2.57 1.50 2.17 2.34
1.91 2.73 2.88 1.83 3.68 2.68
1.45 3.57 3.12 2.59 155 1.43
2.83 2.85 2.19 1.68 3.19 1.38
1.72 2.37 1.15 2.35 2.48 1.81
2.00 3.02 1.94 2.45 1.85 2.24
2.36 3.17 4.04 2.07 1.49 228
2.30 2.57 2.54 2.19 2.78 2.46
2.74 3.58 281 2.75 3.27 1.77
4.69 3.20 2.37 2.00 3.89 2.38
2.85 2.69 2.31 2.83 2.79 2.44
3.38 2.33
2.42 2.43 2.49
2.70 2.45 282 2.69 2.70 2.42
Print
Done
B
向
F7
F8
F9
F10
F11
4
4+
Λ
&
*
)
F12
A
6
7
8
9
0
X
Fin
Lock
Final check
7:07 PM
9/1/2024
Insert
Prt Sc
Del
Backsp

Transcribed Image Text:he difference between the maximum data value and the minimum data val
Range (maximum data value) - (minimum data value)
=
deviation of a set of sample values, denoted by s, is a measure of how m
ay from the mean.
Notation:
s = sample standard deviation
o=population standard deviation
Σ(xx)*
S-n-1
much data values deviate away from the mean.
S=
n(Σx²)-(Σx)²
n(n-1)
ever negative. It is zero only when all of the data values are exactly
r values of s indicate greater amounts of variation.
increase dramatically with one or more outliers.
hits of the standard deviations (such as minutes, feet, pounds) are
ginal data values.
iased estimator of the population standard deviation σ, which m
standard deviation s do not center around the value of σ.
thumb - a crude but simple tool for understanding and interpret
Significantly
Expert Solution
This question has been solved!
Explore an expertly crafted, step-by-step solution for a thorough understanding of key concepts.
Step by stepSolved in 2 steps with 3 images

Knowledge Booster
Similar questions
Recommended textbooks for you
 MATLAB: An Introduction with ApplicationsStatisticsISBN:9781119256830Author:Amos GilatPublisher:John Wiley & Sons Inc
 Probability and Statistics for Engineering and th...StatisticsISBN:9781305251809Author:Jay L. DevorePublisher:Cengage Learning
 Statistics for The Behavioral Sciences (MindTap C...StatisticsISBN:9781305504912Author:Frederick J Gravetter, Larry B. WallnauPublisher:Cengage Learning
 Elementary Statistics: Picturing the World (7th E...StatisticsISBN:9780134683416Author:Ron Larson, Betsy FarberPublisher:PEARSON
 The Basic Practice of StatisticsStatisticsISBN:9781319042578Author:David S. Moore, William I. Notz, Michael A. FlignerPublisher:W. H. Freeman
 Introduction to the Practice of StatisticsStatisticsISBN:9781319013387Author:David S. Moore, George P. McCabe, Bruce A. CraigPublisher:W. H. Freeman

MATLAB: An Introduction with Applications
Statistics
ISBN:9781119256830
Author:Amos Gilat
Publisher:John Wiley & Sons Inc

Probability and Statistics for Engineering and th...
Statistics
ISBN:9781305251809
Author:Jay L. Devore
Publisher:Cengage Learning

Statistics for The Behavioral Sciences (MindTap C...
Statistics
ISBN:9781305504912
Author:Frederick J Gravetter, Larry B. Wallnau
Publisher:Cengage Learning

Elementary Statistics: Picturing the World (7th E...
Statistics
ISBN:9780134683416
Author:Ron Larson, Betsy Farber
Publisher:PEARSON

The Basic Practice of Statistics
Statistics
ISBN:9781319042578
Author:David S. Moore, William I. Notz, Michael A. Fligner
Publisher:W. H. Freeman

Introduction to the Practice of Statistics
Statistics
ISBN:9781319013387
Author:David S. Moore, George P. McCabe, Bruce A. Craig
Publisher:W. H. Freeman