
Glencoe Algebra 1, Student Edition, 9780079039897, 0079039898, 2018
18th Edition
ISBN: 9780079039897
Author: Carter
Publisher: McGraw Hill
expand_more
expand_more
format_list_bulleted
Related questions
Question
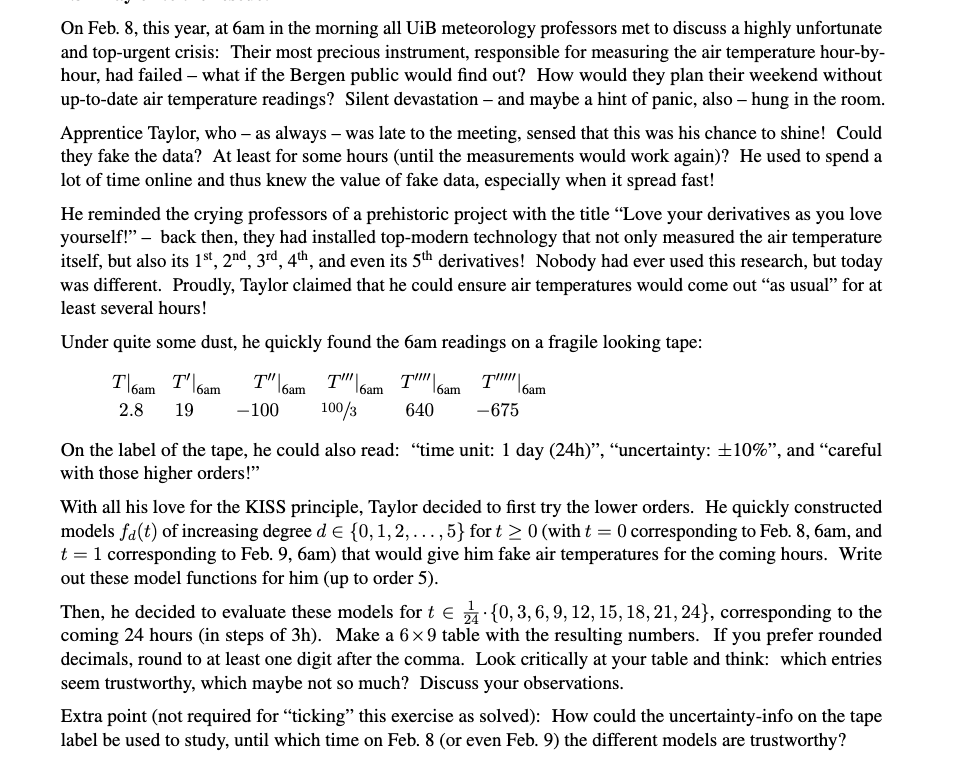

Transcribed Image Text:On Feb. 8, this year, at 6am in the morning all UiB meteorology professors met to discuss a highly unfortunate
and top-urgent crisis: Their most precious instrument, responsible for measuring the air temperature hour-by-
hour, had failed - what if the Bergen public would find out? How would they plan their weekend without
up-to-date air temperature readings? Silent devastation - and maybe a hint of panic, also - hung in the room.
Apprentice Taylor, who - as always - was late to the meeting, sensed that this was his chance to shine! Could
they fake the data? At least for some hours (until the measurements would work again)? He used to spend a
lot of time online and thus knew the value of fake data, especially when it spread fast!
He reminded the crying professors of a prehistoric project with the title "Love your derivatives as you love
yourself!" - back then, they had installed top-modern technology that not only measured the air temperature
itself, but also its 1st, 2nd, 3rd, 4th, and even its 5th derivatives! Nobody had ever used this research, but today
was different. Proudly, Taylor claimed that he could ensure air temperatures would come out "as usual" for at
least several hours!
Under quite some dust, he quickly found the 6am readings on a fragile looking tape:
T\6am
T'
T"
6am
16am
6am
T!!! T!!!!
2.8 19 -100 100/3 640
T!!!!!
6am
6am
-675
On the label of the tape, he could also read: "time unit: 1 day (24h)", "uncertainty: ±10%", and "careful
with those higher orders!"
With all his love for the KISS principle, Taylor decided to first try the lower orders. He quickly constructed
models fa(t) of increasing degree d = {0, 1, 2, . . ., 5} for t≥ 0 (with t = 0 corresponding to Feb. 8, 6am, and
t = 1 corresponding to Feb. 9, 6am) that would give him fake air temperatures for the coming hours. Write
out these model functions for him (up to order 5).
Then, he decided to evaluate these models for t € 24. {0, 3, 6, 9, 12, 15, 18, 21, 24}, corresponding to the
coming 24 hours (in steps of 3h). Make a 6×9 table with the resulting numbers. If you prefer rounded
decimals, round to at least one digit after the comma. Look critically at your table and think: which entries
seem trustworthy, which maybe not so much? Discuss your observations.
Extra point (not required for "ticking" this exercise as solved): How could the uncertainty-info on the tape
label be used to study, until which time on Feb. 8 (or even Feb. 9) the different models are trustworthy?
Expert Solution
This question has been solved!
Explore an expertly crafted, step-by-step solution for a thorough understanding of key concepts.

Step by stepSolved in 2 steps with 2 images

Knowledge Booster

Similar questions
- Bob and Pat are trying to decide where to spend their retirement. They have narrowed the field to four retirement centers. Their decision will be based largely upon the quality of care offered at the hospitals local to each of the retirement communities. They are researching the closest vicinity hospital to each of the retirement centers, and they want to know each hospital's death rate. Use the statistics listed in Table 6 to calculate the gross death rate (rounded to 1 decimal place) for each retirement center. Table 6 Hospital Death Statistics Hospital Death Statistics Hospital Discharged Patients Inpatient Deaths Death Rates Northern Sea Breeze 223 23 Great Plains City 418 28 Rocky Mount Center 215 32 South Beach Cove 319 29…arrow_forwardWhat is the population in this study?arrow_forwardSee pictures for graphics. Problem: Methadone is a synthetic drug whose effect on the body is similar to that of morphine and heroin. Methadone has been used to help people control their addictions to these other drugs. Recently, the governor of Florida vetoed a million-dollar appropriation for several Methadone clinics in the state. Had Methadone use gotten out of hand? The following is a histogram that summarizes information from a study of 25 Florida Methadone clinic patients. (Florida's projected mean daily dosage per Methadone clinic patient was about 100 milligrams.)arrow_forward
- Suppose we want to estimate the annual high temperatures of the hottest major cities in the United States. Below is data from 12 cities with the average annual temperature taken from 1971 to 2000 City Temperature (Fahrenheit) Phoenix, Arizona 87.2 Miami, Florida 84.3 Orlando, Florida 82.8 Riverside, California 80.9 Austin, Texas 79.8 Houston, Texas 79.7 San Antonio, Texas 80.3 Las Vegas, Nevada 80.1 Jacksonville, Florida 79.3 New Orleans, Louisiana 78.2 Tampa, Florida 81.7 Los Angeles, California 75.2 What's the population for this study? What's the sample for this study?arrow_forward3. For a special report in the Cedar Rapids, IA, Gazette, reporters used a radar gun to check the speeds of motorists in two counties. They were shocked (!) to discover that some motorists were driving at a speed greater than the posted limits. They reported the following information in their story: Speeding data for cities in Linn and Johnson Counties City City Speed Counted Limit Cars Over %Over Limit Limit Cedar Rapids Iowa City Iowa City 25 241 233 96.7 35 292 124 42.5 20 203 203 100.0 Marion 30 329 268 81.5 Coralville 25 174 161 92.5 Suppose that one of these drivers is selected at random. Define the followwing events: = the event that a driver was in a city with a speed limit above 25 mph. S= the event that a driver is speeding. a) The table below shows the possible combinations of F and S. For each combination, calculate the probability that the combination would be observed for a randomly selected driver. Enter these probabilities into the corresponding cell in the table. Speed…arrow_forwardaccording to the department of cars ,trucks , and light duty trucks are driven on an average of about 12,000miles per year,and consume on an average roughly 700 gallons of gas. A. What is the average fuel economy in miles per gallon obtained by these vehicles? B.How meny gallons of gas would the average vehicle save each year if average fuel economy increased by 4 miles per gallon? C Assuming that 21.9 pounds of CO2 are emitted for every gallon of gas consumed, how meny fewer pounds of CO2 would the average vehicle emit annually with a 4 miles per gallon increase in fule economy?arrow_forward
- Note: This problem is already on Barleby, but my instructor says the answer is not n=3,794, so I'm stuck! A researcher wants to calculate the prevalence of Alzheimer's among members of a specific community who are 65 years of age and older. The researcher needs to know how many individuals who are 65 years of age or older need to be recruited for the study to ensure the estimated prevalence will be within 1.0% of the true proportion. Calculate the sample size needed by the researcher if a national study has shown 11.11% of individuals 65 years of age have Alzheimer's.arrow_forwardOnly the question 5 and 6 need to be resolved. Others have been reaolved already. Question: sample of 15, 10 years old children was taken to study whether watching television reduces the amount of physical exercise, causing weight gains. The number of kilograms each child was overweight by was recorded (a negative number indicates the child is underweight). In addition, the number of hours of television viewing per week was also recorded. These data are listed in the table below. Television(hours) 42 34 25 35 37 38 31 33 19 29 38 28 29 36 18 Overweight (Kg) 8 3 0 0 6 6 3 3 -4 4 4 2 1 6 -3 Use an appropriate plot to investigate the relationship between Television(hours) and Overweight (KG). Briefly explain the selection of each variable on the X and Y axes and why? Calculate and interpret the coefficient of correlation (r) between Television(hours) and Overweight (KG).…arrow_forwardMay you help me with this? You recently received a job with a company that manufactures an automobile antitheft device. To conduct an advertising campaign for the product, you need to make a claim about the number of automobile thefts per year. Since the population of various cities in the United States varies, you decide to use rates per 10,000 people. (The rates are based on the number of people living in the cities.) Your boss said that last year the theft rate per 10,000 people was 44 vehicles. You want to see if it has changed. The following are rates per 10,000 people for 36 randomly selected locations in the United States. 55 42 125 62 134 73 39 69 23 94 73 24 51 5526 66 41 67 15 53 56 91 20 78 70 25 62 11517 36 58 56 33 75 20 16Perform an appropriate analysis, is there enough evidence to conclude that the car theft rate has changed from 44 at α = 0.05arrow_forward
- An immunologist is interested in whether the number of symptoms of the flu a person first exhibits is related to how many days that person will be sick. What is the appropriate test?arrow_forwardWeatherwise is a magazine published by the American Meteorological Society. One issue gives a rating system used to classify Nor'easter storms that frequently hit New England and can cause much damage near the ocean. A severe storm has an average peak wave height of ? = 16.4 feet for waves hitting the shore. Suppose that a Nor'easter is in progress at the severe storm class rating. Peak wave heights are usually measured from land (using binoculars) off fixed cement piers. Suppose that a reading of 33 waves showed an average wave height of x = 17.3 feet. Previous studies of severe storms indicate that ? = 3.5 feet. Does this information suggest that the storm is (perhaps temporarily) increasing above the severe rating? Use ? = 0.01.arrow_forwardAverage adult Americans are about one inch taller, but nearly a whopping 25 pounds heavier than they were in 1960, according to a new report from the Centers for Disease Control and Prevention (CDC). The bad news, says CDC is that average BMI (body mass index, a weight-for-height formula used to measure obesity) has increased among adults...” Boston is considered one of America’s healthiest cities – is the weight gain since 1960 similar in Boston? A sample of n=28 adults suggested a mean increase of 19.5 pounds over the mean recorded in 1960 with a standard deviation of 8.6 pounds. Is Boston statistically significantly different in terms of weight gain from the national mean since 1960? Run the appropriate test at a 5% level of significance. Please use the five steps to demonstrate proper hypothesis testing and explain your results. Please do not use any software calculations.arrow_forward
arrow_back_ios
SEE MORE QUESTIONS
arrow_forward_ios
Recommended textbooks for you
- Glencoe Algebra 1, Student Edition, 9780079039897...AlgebraISBN:9780079039897Author:CarterPublisher:McGraw Hill
Glencoe Algebra 1, Student Edition, 9780079039897...
Algebra
ISBN:9780079039897
Author:Carter
Publisher:McGraw Hill