MATLAB: An Introduction with Applications
6th Edition
ISBN: 9781119256830
Author: Amos Gilat
Publisher: John Wiley & Sons Inc
expand_more
expand_more
format_list_bulleted
Question

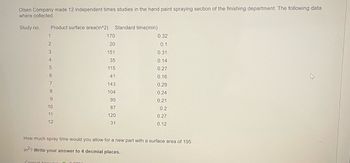
Transcribed Image Text:Olsen Company made 12 independent times studies in the hand paint spraying section of the finishing department. The following data
where collected.
Study no.
Product surface area (in^2) Standard time(min)
1
170
0.32
2
20
0.1
3
151
0.31
4
35
0.14
5
115
0.27
6
41
0.16
7
143
0.29
8
104
0.24
9
95
0.21
10
87
0.2
11
120
0.27
12
31
0.12
How much spray time would you allow for a new part with a surface area of 195
in2? Write your answer to 4 decmial places.
Correct Answer
0.3704
Expert Solution
This question has been solved!
Explore an expertly crafted, step-by-step solution for a thorough understanding of key concepts.
Step by stepSolved in 3 steps with 4 images

Knowledge Booster
Similar questions
- I need help to find R^2 and Press final answers. Everything needed is attached also the contribution data.arrow_forwardAssignment: Analyze Filling Line Problems Using Control Charting Attached Files: File Filling line example for X-bar & control chart.xlsxOpen this document with ReadSpeaker docReader (13.354 KB) Using the provided data, calculate the control limits (X-bar and r-chart, Capability Index, create a control chart, and calculate the percentage of units that are expected to be out of spec (z-value). Show your work A quick way to do the percents part of the filling line problem (you know, the percent underfilled, the percent overfilled, etc.), is to use Excel's norm.dist function rather than looking it up on a printed Z table. Use the norm.dist excel function with the LSL in the first position in the parameter list. Norm.dist gives you the left side return from the Z table. "Excel offers you the NORM.DIST statistical function for working with normal distributions. The NORM.DIST function calculates the probability that variable X falls below or at a specified value"…arrow_forwardPlease round to 5 decimal placesarrow_forward
- first picture is the background informationarrow_forwardResearcher wanted to determine if carpeted rooms containe more bacteria than uncarpted rooms. Colonies of bacteria were allowed to form in the 16 Petri dishes. A normal probality plot and boxplot indicate that the data are aproximately normally distributed with no outliers. Do carpted rooms have more bacteria than uncarpted roomz at the a= 0.05 level of signicance? carpeted rooms (bacteria/cubic foot) 11.8, 8.2, 7.1, 13, 10.8, 10.1 14.6, 14 uncarpted room( bacteria/cubic foot) 12.1, 8.3, 3.8, 7.2, 12, 11.1 10.1 13.7 a) Is this independent or dependent sampling? b) State the null and alternative hypotheses c) P-value: d) state your conclusion in the langauage of the problem.arrow_forwardOverproduction of uric acid in the body can be an Indication of cell breakdown. This may be an advance indication of liness such as gout, leukemia, or lymphoma. Over a period of months, an adult male patient has taken five blood tests for uric acid. The mean concentration was x- 5.35 mg/dl. The distribution of uric acid in healthy adult males can be assumed to be normal, with a-1.81 mg/dl. (a) Find a 95 % confidence interval for the population mean concentration of uric acid in this patient's blood. What is the margin of error? (b) What conditions are necessary for your calculations? (c) Interpret your results in the context of this problem. (d) Sample size Find the sample size necessary for 95% confidence level with a maximal margin of error E = 1.10 for the mean concentration of uric acid in this patient's blood. Thank youarrow_forward
arrow_back_ios
arrow_forward_ios
Recommended textbooks for you
 MATLAB: An Introduction with ApplicationsStatisticsISBN:9781119256830Author:Amos GilatPublisher:John Wiley & Sons Inc
 Probability and Statistics for Engineering and th...StatisticsISBN:9781305251809Author:Jay L. DevorePublisher:Cengage Learning
 Statistics for The Behavioral Sciences (MindTap C...StatisticsISBN:9781305504912Author:Frederick J Gravetter, Larry B. WallnauPublisher:Cengage Learning
 Elementary Statistics: Picturing the World (7th E...StatisticsISBN:9780134683416Author:Ron Larson, Betsy FarberPublisher:PEARSON
 The Basic Practice of StatisticsStatisticsISBN:9781319042578Author:David S. Moore, William I. Notz, Michael A. FlignerPublisher:W. H. Freeman
 Introduction to the Practice of StatisticsStatisticsISBN:9781319013387Author:David S. Moore, George P. McCabe, Bruce A. CraigPublisher:W. H. Freeman

MATLAB: An Introduction with Applications
Statistics
ISBN:9781119256830
Author:Amos Gilat
Publisher:John Wiley & Sons Inc

Probability and Statistics for Engineering and th...
Statistics
ISBN:9781305251809
Author:Jay L. Devore
Publisher:Cengage Learning

Statistics for The Behavioral Sciences (MindTap C...
Statistics
ISBN:9781305504912
Author:Frederick J Gravetter, Larry B. Wallnau
Publisher:Cengage Learning

Elementary Statistics: Picturing the World (7th E...
Statistics
ISBN:9780134683416
Author:Ron Larson, Betsy Farber
Publisher:PEARSON

The Basic Practice of Statistics
Statistics
ISBN:9781319042578
Author:David S. Moore, William I. Notz, Michael A. Fligner
Publisher:W. H. Freeman

Introduction to the Practice of Statistics
Statistics
ISBN:9781319013387
Author:David S. Moore, George P. McCabe, Bruce A. Craig
Publisher:W. H. Freeman