
MATLAB: An Introduction with Applications
6th Edition
ISBN: 9781119256830
Author: Amos Gilat
Publisher: John Wiley & Sons Inc
expand_more
expand_more
format_list_bulleted
Related questions
Question
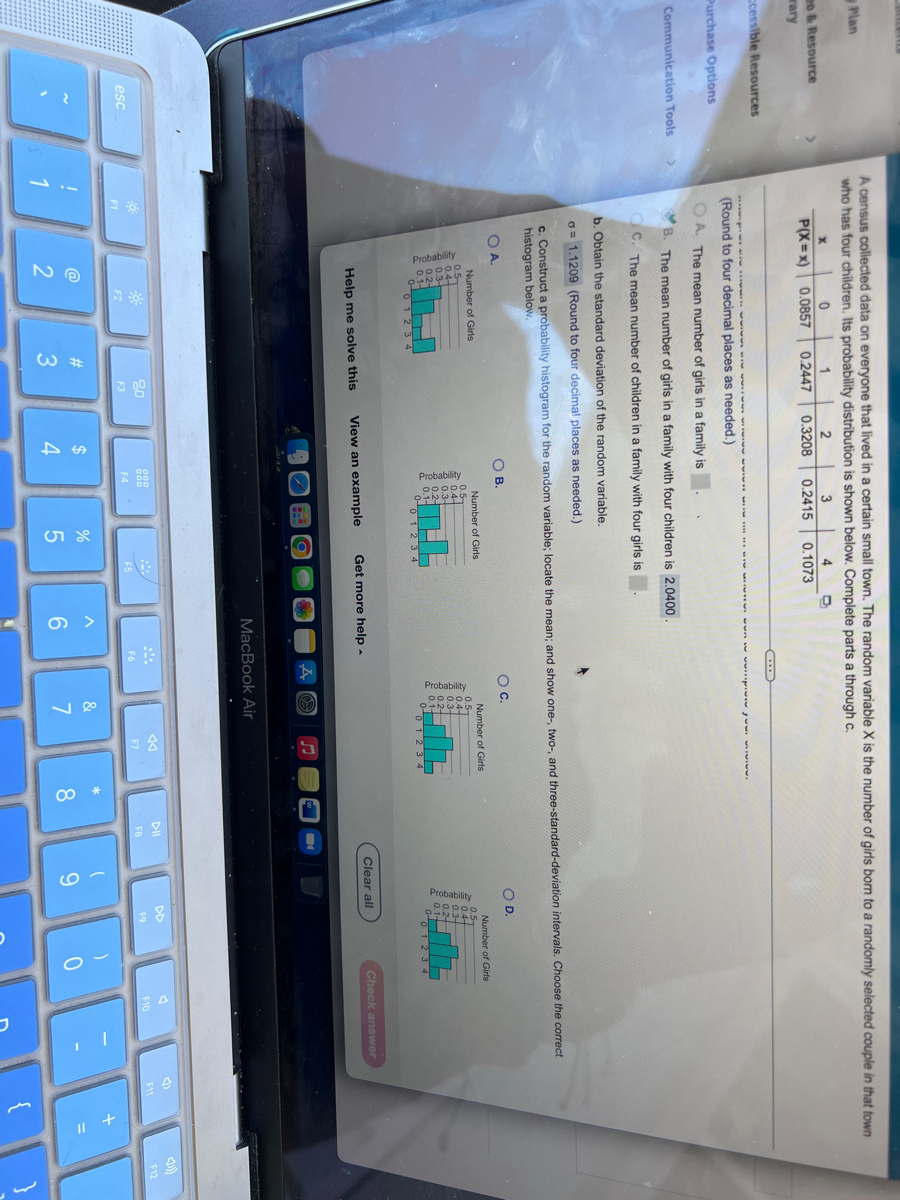

Transcribed Image Text:### Statistical Analysis and Probability Distributions: Understanding Binomial Distribution
---
#### Problem Context:
A survey was conducted in a town where each family had four children. The objective is to understand the distribution of the number of girls in these families.
#### Given Data:
- **Random Variable \(X\)**: Number of girls born to a randomly selected couple in a town with four children.
- The probability distribution for the random variable \(X\) is given, representing the number of girls (0, 1, 2, 3, or 4).
| \( X \) | P( \( X = x \) ) |
|--------|------------------|
| 0 | 0.0625 |
| 1 | 0.2500 |
| 2 | 0.3750 |
| 3 | 0.2500 |
| 4 | 0.0625 |
#### Tasks:
1. **Calculate the Mean**:
- The mean number of girls in the family is \( 2.0 \).
2. **Calculate the Standard Deviation**:
- The standard deviation for the number of girls is \( 1.00 \).
3. **Probability Histogram**:
- You are provided with four histogram options to visually represent the probability distribution of the random variable \(X\).
---
#### Detailed Description of Histogram Options:
- **Option A**:
- Probability values are represented on the vertical axis.
- Number of girls is represented on the horizontal axis (from 0 to 4).
- The heights of the bars correspond to the probabilities 0.0625, 0.2500, 0.3750, 0.2500, and 0.0625 respectively from 0 to 4.
- **Option B**:
- Similar to Option A but with an incorrect probability representation.
- **Option C**:
- Similar to Option A but with an incorrect probability representation.
- **Option D**:
- Similar to Option A but with an incorrect probability representation.
---
#### Correct Histogram Selection:
- The correct histogram should reflect the probabilities 0.0625, 0.2500, 0.3750, 0.2500, and 0.0625 for the values 0, 1, 2, 3
Expert Solution
This question has been solved!
Explore an expertly crafted, step-by-step solution for a thorough understanding of key concepts.

Step by stepSolved in 4 steps with 1 images

Knowledge Booster

Similar questions
- About 4% of children in the United States are allergic to peanuts. Choose three children at random and let the random variable ?� be the number in this sample who are allergic to peanuts. The possible values ?� can take are 0, 1, 2, and .3. Make a three‑stage tree diagram of the outcomes (allergic or not allergic) for the three individuals and use it to find the probability distribution of ?.�. Give your answers to six decimal places. ?(?=0)=(=0)= ?(?=1)=(�=1)= ?(?=2)=(�=2)= ?(?=3)=(�=3)=arrow_forwardGender/Party Democrat Republican Independent Totals Male 21 25 29 Female 57 60 65 Totals The contingency table shows the distribution for Males and Females with respect to political party affiliation in an online survey. Complete the table and answer the question.One person from the survey was chosen at random. Find the probability that the person is Female and Democrat. A. 0.6868 B. 0.2218 C. 0.7782 D. 0.2529 E. 0.3132arrow_forwardAnswer as percent rounded 2 decimalsarrow_forward
- Using the Table and the data found in part c please answer the question in part e.arrow_forwardI need help with this. Please get back asap thanks.arrow_forwardIf a die is rolled one time, find the probabilities of rolling a number that is less than or equal to 1. Write Answer as a Fraction (Not Simplified) Write Answer as a Percent Round to Two Decimal Places PO Select an answer v) Question Help: Message instructor Submit Question How Many of Y...pdf 000 F8 吕0 F3 F7 F4 #3 $ & * 6 7 8 9arrow_forward
- The percentage of the general population that has each blood type is shown in the table below. Determine the probability distribution associated with these data. (Enter your answers to two decimal places.) Blood Type A B AB O Population, % 40 13 4 43 Probabilityarrow_forwardPlease provide solution asap.And mention final answer justifiedarrow_forwardPlease provide solution asap.And mention final answer justifiedarrow_forward
- LD Page view A Read aloud V Draw Highlight O Erase QUESTION6 A fair die has one face numbered 1, one face numbered 3, two faces numbered 5 and two faces numbered 6. (i) Find the probability of obtaining at least 7 odd numbers in 8 throws of the die. The die is thrown twice. Let X be the sum of the two scores. The following table shows the possible values of X. Second throw 9. 2. 7. 7. 9. 6. 9. 8. 10 10 11 11 10 10 11 11 7. 9. 11 11 12 12 7. 6. 11 11 12 12 (59 5. 6. 3. 4. 1. 3. 5. 5. 6. First throwarrow_forwardUse the table to the right, which shows the age distribution of those who earned less than minimum wage in a recent year. If a worker is randomly selected from those surveyed, what is the probability that the person is younger than 55? Age Working Below Minimum Wage (thousands) 16-19 348 20-24 416 25-34 305 35-44 175 45-54 132 55-64 47 65 and older 40 Question content area bottom Part 1 The probability that the person is younger than 55 is enter your response here . (Type a decimal rounded to three decimal places as needed.)arrow_forwardhwm7 17 The table summarizes results from 980 pedestrian deaths that were caused by automobile accidents. DriverIntoxicated? Pedestrian Intoxicated? Yes No Yes 50 80 No 219 631 If two different pedestrian deaths are randomly selected, find the probability that they both involved drivers that were intoxicated.Report the answer as a percent rounded to one decimal place accuracy.arrow_forward
arrow_back_ios
SEE MORE QUESTIONS
arrow_forward_ios
Recommended textbooks for you
- MATLAB: An Introduction with ApplicationsStatisticsISBN:9781119256830Author:Amos GilatPublisher:John Wiley & Sons Inc
 Probability and Statistics for Engineering and th...StatisticsISBN:9781305251809Author:Jay L. DevorePublisher:Cengage Learning
 Statistics for The Behavioral Sciences (MindTap C...StatisticsISBN:9781305504912Author:Frederick J Gravetter, Larry B. WallnauPublisher:Cengage Learning
  Elementary Statistics: Picturing the World (7th E...StatisticsISBN:9780134683416Author:Ron Larson, Betsy FarberPublisher:PEARSON
 The Basic Practice of StatisticsStatisticsISBN:9781319042578Author:David S. Moore, William I. Notz, Michael A. FlignerPublisher:W. H. Freeman
 Introduction to the Practice of StatisticsStatisticsISBN:9781319013387Author:David S. Moore, George P. McCabe, Bruce A. CraigPublisher:W. H. Freeman
MATLAB: An Introduction with Applications
Statistics
ISBN:9781119256830
Author:Amos Gilat
Publisher:John Wiley & Sons Inc
Probability and Statistics for Engineering and th...
Statistics
ISBN:9781305251809
Author:Jay L. Devore
Publisher:Cengage Learning
Statistics for The Behavioral Sciences (MindTap C...
Statistics
ISBN:9781305504912
Author:Frederick J Gravetter, Larry B. Wallnau
Publisher:Cengage Learning
Elementary Statistics: Picturing the World (7th E...
Statistics
ISBN:9780134683416
Author:Ron Larson, Betsy Farber
Publisher:PEARSON
The Basic Practice of Statistics
Statistics
ISBN:9781319042578
Author:David S. Moore, William I. Notz, Michael A. Fligner
Publisher:W. H. Freeman
Introduction to the Practice of Statistics
Statistics
ISBN:9781319013387
Author:David S. Moore, George P. McCabe, Bruce A. Craig
Publisher:W. H. Freeman