
MATLAB: An Introduction with Applications
6th Edition
ISBN: 9781119256830
Author: Amos Gilat
Publisher: John Wiley & Sons Inc
expand_more
expand_more
format_list_bulleted
Related questions
Question

Transcribed Image Text:Jy My Drive
My Drive Google [ *
થશ
ucture.com/courses/946/quizzes/24446/take
Why Drive Google.f
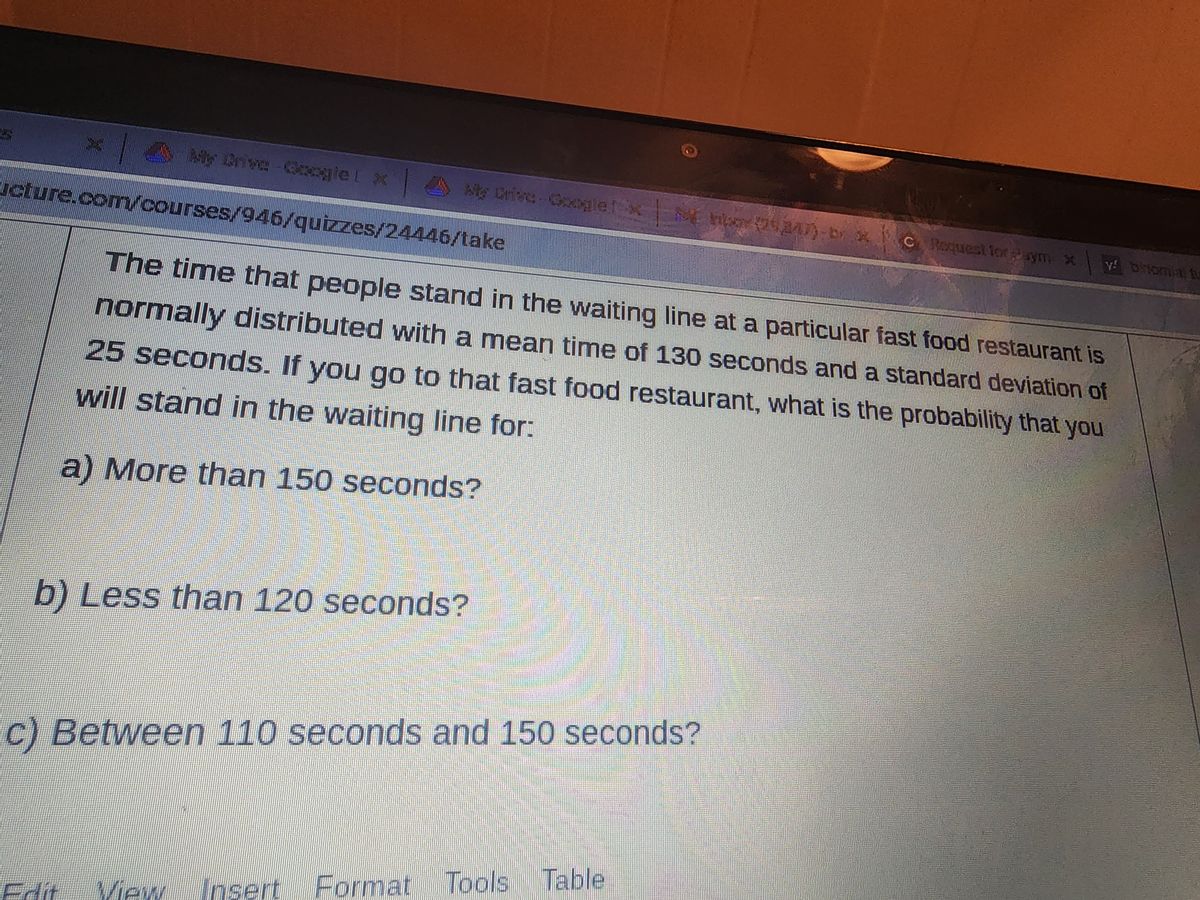
b) Less than 120 seconds?
The time that people stand in the waiting line at a particular fast food restaurant is
normally distributed with a mean time of 130 seconds and a standard deviation of
25 seconds. If you go to that fast food restaurant, what is the probability that you
will stand in the waiting line for:
a) More than 150 seconds?
Abby (22)-by s
c) Between 110 seconds and 150 seconds?
Insert Format Tools
Table
C Request for aym X
Expert Solution
This question has been solved!
Explore an expertly crafted, step-by-step solution for a thorough understanding of key concepts.

Step by stepSolved in 3 steps

Knowledge Booster

Similar questions
- Trucks in a delivery fleet travel a mean of 100 miles per day with a standard deviation of 38 miles per day. The mileage per day is distributed normally. Find the probability that a truck drives at least 141 miles in a day. Round your answer to four decimal places.arrow_forwardPlease explain. Thanks.arrow_forwardAssume that adults have IQ scores that are normally distributed with a mean of u= 100 and a standard deviation o = 15. Find the probability that a randomly selected adult has an IQ less than 118. Click to view page 1 of the table Click to view page 2 of the table The probability that a randomly selected adult has an IQ less than 118 is (Type an integer or decimal rounded to four decimal places as needed.)arrow_forward
- According to a study done by De Anza students, the height for Asian adult males is normally distributed with an average of 66 inches and a standard deviation of 2.5 inches. Suppose one Asian adult male is randomly chosen. Let X = height of the individual. Find the probability that the person is between 64 and 69 inches. The middle 40% of heights fall between what two values?Write the probability statement. State the two values. (Round your answers to one decimal place.) x1,x2 ch6#9arrow_forwardPlease answer within 30min thanks.arrow_forwardneed help pleasearrow_forward
- Citizens use an average of 650 pounds of paper a year. Suppose that the distribution is normal with a population standard deviation of 153.5 pounds. Suppose you take a random sample of 25 Citizens. What is the probability that the mean pounds of paper used in a year are between 500 and 700 poundsarrow_forward6arrow_forwardJA researcher takes an SRS of 80 people who go golfing.The average to be u52 years old. It was also determined that the standard deviation of cac ot golfers was la What is the probability that the sample mean is kss. than 47 years old? age of all golferswas determined years.arrow_forward
- Cody took his first physics exam and scored an 80. The population mean for this exam is 70, and the standard deviation is 5. What is the probability of selecting a person with a score greater than Cody’s?arrow_forwardStudent scores on Professor of Stats final exam are normally distributed with a mean of 73 and a standard deviation of 6.5Find the probability of the following:**(use 4 decimal places)**a.) The probability that one student chosen at random scores above an 78. ________b.) The probability that 20 students chosen at random have a mean score above an 78. _________c.) The probability that one student chosen at random scores between a 68 and an 78. __________d.) The probability that 20 students chosen at random have a mean score between a 68 and an 78. __________arrow_forwardThe NJ Department of Health has reported the average life span of NJ residents is 81 years. If the standard deviation is σ = 4 years, what is the probability of a person living to at least 92 years of age?arrow_forward
arrow_back_ios
SEE MORE QUESTIONS
arrow_forward_ios
Recommended textbooks for you
- MATLAB: An Introduction with ApplicationsStatisticsISBN:9781119256830Author:Amos GilatPublisher:John Wiley & Sons Inc
 Probability and Statistics for Engineering and th...StatisticsISBN:9781305251809Author:Jay L. DevorePublisher:Cengage Learning
 Statistics for The Behavioral Sciences (MindTap C...StatisticsISBN:9781305504912Author:Frederick J Gravetter, Larry B. WallnauPublisher:Cengage Learning
  Elementary Statistics: Picturing the World (7th E...StatisticsISBN:9780134683416Author:Ron Larson, Betsy FarberPublisher:PEARSON
 The Basic Practice of StatisticsStatisticsISBN:9781319042578Author:David S. Moore, William I. Notz, Michael A. FlignerPublisher:W. H. Freeman
 Introduction to the Practice of StatisticsStatisticsISBN:9781319013387Author:David S. Moore, George P. McCabe, Bruce A. CraigPublisher:W. H. Freeman
MATLAB: An Introduction with Applications
Statistics
ISBN:9781119256830
Author:Amos Gilat
Publisher:John Wiley & Sons Inc
Probability and Statistics for Engineering and th...
Statistics
ISBN:9781305251809
Author:Jay L. Devore
Publisher:Cengage Learning
Statistics for The Behavioral Sciences (MindTap C...
Statistics
ISBN:9781305504912
Author:Frederick J Gravetter, Larry B. Wallnau
Publisher:Cengage Learning
Elementary Statistics: Picturing the World (7th E...
Statistics
ISBN:9780134683416
Author:Ron Larson, Betsy Farber
Publisher:PEARSON
The Basic Practice of Statistics
Statistics
ISBN:9781319042578
Author:David S. Moore, William I. Notz, Michael A. Fligner
Publisher:W. H. Freeman
Introduction to the Practice of Statistics
Statistics
ISBN:9781319013387
Author:David S. Moore, George P. McCabe, Bruce A. Craig
Publisher:W. H. Freeman