
MATLAB: An Introduction with Applications
6th Edition
ISBN: 9781119256830
Author: Amos Gilat
Publisher: John Wiley & Sons Inc
expand_more
expand_more
format_list_bulleted
Related questions
Concept explainers
Question
Office occupancy in a city is an indication of the economic health of the region in which it is located. Suppose a random sample of offices in Boston and Chicago was selected and the number of vacancies was recorded. Round all answers to four decimal places.
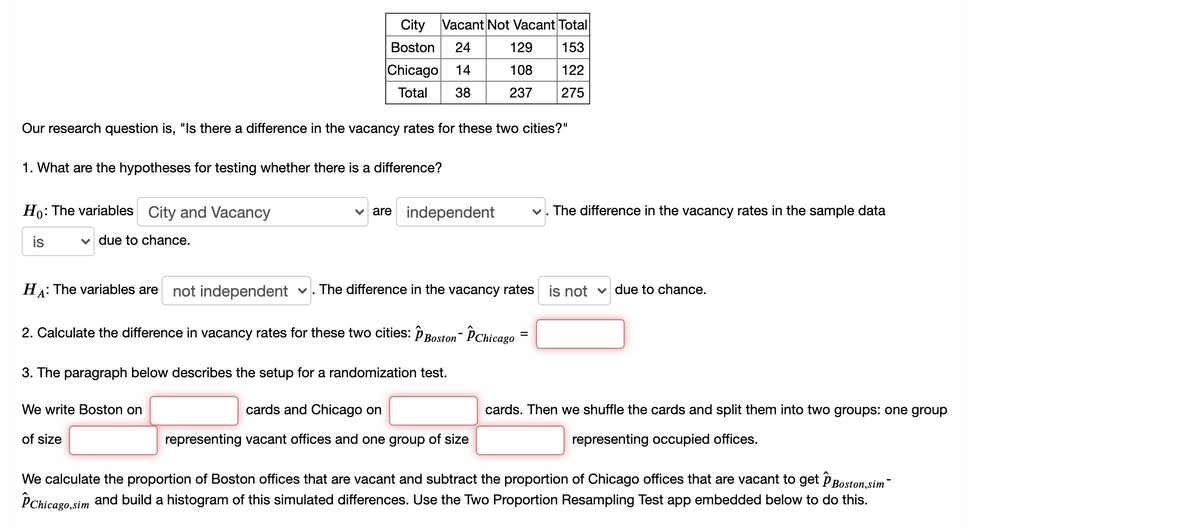

Transcribed Image Text:City
Vacant Not Vacant Total
Boston
24
129
153
Chicago
14
108
122
Total
38
237
275
Our research question is, "Is there a difference in the vacancy rates for these two cities?"
1. What are the hypotheses for testing whether there is a difference?
Ho: The variables City and Vacancy
are independent
v. The difference in the vacancy rates in the sample data
is
v due to chance.
The variables are
HA:
not independent v. The difference in the vacancy rates is not v due to chance.
2. Calculate the difference in vacancy rates for these two cities: P Boston- PChicago
3. The paragraph below describes the setup for a randomization test.
We write Boston on
cards and Chicago on
cards. Then we shuffle the cards and split them into two groups: one group
of size
representing vacant offices and one group of size
representing occupied offices.
We calculate the proportion of Boston offices that are vacant and subtract the proportion of Chicago offices that are vacant to get P Boston.sim'
PChicagosim and build a histogram of this simulated differences. Use the Two Proportion Resampling Test app embedded below to do this.
Expert Solution
This question has been solved!
Explore an expertly crafted, step-by-step solution for a thorough understanding of key concepts.

This is a popular solution

Trending nowThis is a popular solution!

Step by stepSolved in 2 steps with 1 images

Knowledge Booster


Learn more about
Need a deep-dive on the concept behind this application? Look no further. Learn more about this topic, statistics and related others by exploring similar questions and additional content below.Similar questions
- Please do not give solution in image format thankuarrow_forwardAs part of a sixth-grade class project the teacher brings to class a jar containing 200 gumballs of two different colors: red and green. Andy is asked to draw a sample of his own choosing and estimate the number of red gumballs in the jar. Andy draws a sample of 25 gumballs, of which 8 are red and 17 are green. Use Andy's sample to estimate the number of red gumballs in the jar. There are approximately Answer red gumballs in the jar.arrow_forwardThe manager of a book store surveys people who buy mystery novels to see if the store should expand its hours. What is the population and the sample here?arrow_forward
- Carmen and Rosanna are two employees in an electronics store. The store manager has put an emphasis on increasing the number of applications for the store credit card. The manager randomly selected 24 weeks for each employee and recorded the number of completed applications for each week, which is provided in the samples below. Each employee completed 21 applications in one of the weeks selected. Use Excel to calculate each employee's z-score for completing 21 applications. Round your answers to two decimal places. Carmen Rosanna11 56 1115 613 185 1114 1416 521 208 1110 97 1416 1513 1310 619 2118 95 1817 310 126 1712 1214 419 1017 8arrow_forwardFifty randomly selected car salespersons were asked the number of cars they generally sell in one week. Nine people answered that they generally sell three cars; thirteen generally sell four cars; ten generally sell five cars; seven generally sell six cars; eleven generally sell seven cars. Complete the table. Data Value (# cars) Frequency Relative Frequency Cumulative Relative Frequency 3 4 6. 7arrow_forwardExplain the relation between a population and a sample. What characteristics should a sample have to be representative of the population?arrow_forward
arrow_back_ios
arrow_forward_ios
Recommended textbooks for you
- MATLAB: An Introduction with ApplicationsStatisticsISBN:9781119256830Author:Amos GilatPublisher:John Wiley & Sons Inc
 Probability and Statistics for Engineering and th...StatisticsISBN:9781305251809Author:Jay L. DevorePublisher:Cengage Learning
 Statistics for The Behavioral Sciences (MindTap C...StatisticsISBN:9781305504912Author:Frederick J Gravetter, Larry B. WallnauPublisher:Cengage Learning
  Elementary Statistics: Picturing the World (7th E...StatisticsISBN:9780134683416Author:Ron Larson, Betsy FarberPublisher:PEARSON
 The Basic Practice of StatisticsStatisticsISBN:9781319042578Author:David S. Moore, William I. Notz, Michael A. FlignerPublisher:W. H. Freeman
 Introduction to the Practice of StatisticsStatisticsISBN:9781319013387Author:David S. Moore, George P. McCabe, Bruce A. CraigPublisher:W. H. Freeman
MATLAB: An Introduction with Applications
Statistics
ISBN:9781119256830
Author:Amos Gilat
Publisher:John Wiley & Sons Inc
Probability and Statistics for Engineering and th...
Statistics
ISBN:9781305251809
Author:Jay L. Devore
Publisher:Cengage Learning
Statistics for The Behavioral Sciences (MindTap C...
Statistics
ISBN:9781305504912
Author:Frederick J Gravetter, Larry B. Wallnau
Publisher:Cengage Learning
Elementary Statistics: Picturing the World (7th E...
Statistics
ISBN:9780134683416
Author:Ron Larson, Betsy Farber
Publisher:PEARSON
The Basic Practice of Statistics
Statistics
ISBN:9781319042578
Author:David S. Moore, William I. Notz, Michael A. Fligner
Publisher:W. H. Freeman
Introduction to the Practice of Statistics
Statistics
ISBN:9781319013387
Author:David S. Moore, George P. McCabe, Bruce A. Craig
Publisher:W. H. Freeman