
MATLAB: An Introduction with Applications
6th Edition
ISBN: 9781119256830
Author: Amos Gilat
Publisher: John Wiley & Sons Inc
expand_more
expand_more
format_list_bulleted
Related questions
Question
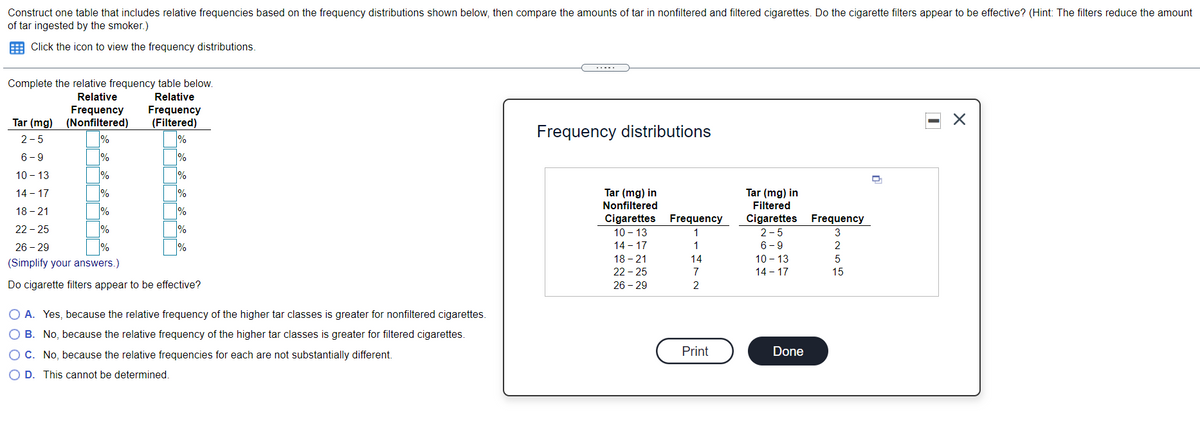

Transcribed Image Text:Construct one table that includes relative frequencies based on the frequency distributions shown below, then compare the amounts of tar in nonfiltered and filtered cigarettes. Do the cigarette filters appear to be effective? (Hint: The filters reduce the amount
of tar ingested by the smoker.)
E Click the icon to view the frequency distributions.
Complete the relative frequency table below.
Relative
Frequency
Tar (mg) (Nonfiltered)
Relative
Frequency
(Filtered)
Frequency distributions
2-5
6 -9
%
10 - 13
%
%
14 - 17
Tar (mg) in
Tar (mg) in
Nonfiltered
Filtered
18 - 21
%
Cigarettes
10 - 13
14 - 17
Frequency
Cigarettes Frequency
22 - 25
%
%
1
2-5
3
26 - 29
%
1
6 - 9
18 - 21
14
10 - 13
(Simplify your answers.)
22 - 25
7
14 - 17
15
Do cigarette filters appear to be effective?
26 - 29
2
O A. Yes, because the relative frequency of the higher tar classes is greater for nonfiltered cigarettes.
O B. No, because the relative frequency of the higher tar classes is greater for filtered cigarettes.
O C. No, because the relative frequencies for each are not substantially different.
Print
Done
O D. This cannot be determined.
Expert Solution
This question has been solved!
Explore an expertly crafted, step-by-step solution for a thorough understanding of key concepts.

This is a popular solution

Trending nowThis is a popular solution!

Step by stepSolved in 3 steps with 3 images

Knowledge Booster

Similar questions
- The following table gives the frequency distribution of the commute distances (in miles) for the population of 50 instructors at a local community college. Commute Distance (miles) Frequency 11 - 15 9 16 - 20 14 21 - 25 12 26 - 30 8 31 - 35 5 36 - 40 2 What is the Class Width for this frequency distribution? Class Width = [cw] miles = ______________arrow_forward??arrow_forward...........arrow_forward
- Recall that a relative frequency histogram is used to graph quantitative data. Classes are chosen to divide the range of values into equal-length subintervals, then plotted along the horizontal axis. A bar is drawn for each class with height equal to the relative frequency for that class. To create a relative frequency histogram, first summarize the following data in a frequency table. 1 N 2 3 4 5 6 7 Class Class Boundaries 8 9 1.3 10 11 14.7 9.0 16.7 4.1 14.9 4.4 2.7 32.3 10.9 9.0 9.0 1.6 18.4 1.0 2.4 2.4 18.0 Since the measurements are all between the values 0 and 33, it will be convenient to choose 11 class intervals of length 3. Using the given data, tally the values within each class interval to determine the frequency of each class, and fill in the following table. 0 to <3 3.5 11.2 18.0 26.7 3.7 3 to 6 6 to 9 9 to 12 12 to < 15 15 to 18 18 to 21 21 to 24 24 to 27 0.2 6.1 13.5 27 to < 30 30 to 33 7.4 8.2 19.2 1 1 2 1 Frequency 10 5 1 4 1 X X 9.4 X 8.7 X 2.0 6.6 3.9 5.9 4.3 3.3 0.2…arrow_forwardThe following are goals scored by a soccer team at each game in their recent season. 00 0 0 1 1 1 1 1 1 2 2 2 5 0 Complete the relative frequency table. Goals Frequency 1 2 3 4 0 0 1 1 3 5 1 1 1 3 4 4 6 11 3 2 2 1 Relative Frequencyarrow_forwardMy answers were incorrect ?arrow_forward
- Q1arrow_forwardUsing the table below to calculate all the relative frequencies (A-E) and all the cumulative frequencies (AA - EE). PARTICIPATING AGE INTERVAL FREQUENCY RELATIVE FREQUENCY RELATIVE FREQUENCY 10-19 2 A AA 20-29 10 B BB 30-39 34 C CC 40-49 3 D DD 50-59 1 E EE What value would be in box B?arrow_forwardChearrow_forward
- Here are the quiz scores (out of 50) on a past quiz. Construct a Relative Frequency Table. 36 42 42 42 42 41 38 41 40 42 43 44 45 45 46 44 43 48 43 42 43 41 50 38 38 40 44 Class Limits Lower - Upper Class Boundaries Lower - Upper Tally Frequency Class Midpoint Relative Frequency (f/n)arrow_forwardMY NOTES ASK YO Suppose that the following relative frequency table represents hurricanes that have made direct hits on land. Hurricanes are given a strength category rating based on the maximum wind speed generated by the storm. Frequency of Hurricane Direct Hits Category Number of Direct Hits Relative Frequency Cumulative Frequency 1 105 0.3723 87 0.3085 0.6809 3 66 0.2340 4 19 0.9823 0.0177 1.0000 Total = 282 What is the relative frequency of direct hits that were AT MOST a category 3 storm? (Round your answer to four decimal places.) 0.2340arrow_forwardGive answer clearlyarrow_forward
arrow_back_ios
SEE MORE QUESTIONS
arrow_forward_ios
Recommended textbooks for you
- MATLAB: An Introduction with ApplicationsStatisticsISBN:9781119256830Author:Amos GilatPublisher:John Wiley & Sons Inc
 Probability and Statistics for Engineering and th...StatisticsISBN:9781305251809Author:Jay L. DevorePublisher:Cengage Learning
 Statistics for The Behavioral Sciences (MindTap C...StatisticsISBN:9781305504912Author:Frederick J Gravetter, Larry B. WallnauPublisher:Cengage Learning
  Elementary Statistics: Picturing the World (7th E...StatisticsISBN:9780134683416Author:Ron Larson, Betsy FarberPublisher:PEARSON
 The Basic Practice of StatisticsStatisticsISBN:9781319042578Author:David S. Moore, William I. Notz, Michael A. FlignerPublisher:W. H. Freeman
 Introduction to the Practice of StatisticsStatisticsISBN:9781319013387Author:David S. Moore, George P. McCabe, Bruce A. CraigPublisher:W. H. Freeman
MATLAB: An Introduction with Applications
Statistics
ISBN:9781119256830
Author:Amos Gilat
Publisher:John Wiley & Sons Inc
Probability and Statistics for Engineering and th...
Statistics
ISBN:9781305251809
Author:Jay L. Devore
Publisher:Cengage Learning
Statistics for The Behavioral Sciences (MindTap C...
Statistics
ISBN:9781305504912
Author:Frederick J Gravetter, Larry B. Wallnau
Publisher:Cengage Learning
Elementary Statistics: Picturing the World (7th E...
Statistics
ISBN:9780134683416
Author:Ron Larson, Betsy Farber
Publisher:PEARSON
The Basic Practice of Statistics
Statistics
ISBN:9781319042578
Author:David S. Moore, William I. Notz, Michael A. Fligner
Publisher:W. H. Freeman
Introduction to the Practice of Statistics
Statistics
ISBN:9781319013387
Author:David S. Moore, George P. McCabe, Bruce A. Craig
Publisher:W. H. Freeman