
MATLAB: An Introduction with Applications
6th Edition
ISBN: 9781119256830
Author: Amos Gilat
Publisher: John Wiley & Sons Inc
expand_more
expand_more
format_list_bulleted
Related questions
Question
| Company | End of 1st Quarter | Beginning of Year |
| Bank of New York | 25.13 | 18.51 |
| Kraft Foods | 39.61 | 34.66 |
| Dupont | 54.50 | 43.88 |
| Consolidated Edison | 61.12 | 60.73 |
| Johnson & Johnson | 67.46 | 64.08 |
| Union Pacific | 109.18 | 103.94 |
| Comcast | 32.51 | 22.41 |
| Applied Materials | 13.55 | 9.61 |
| Pfiser | 44.81 | 39.22 |
| General Electric | 22.47 | 16.21 |
| AT&T | 32.43 | 28.84 |
| Cisco Systems | 22.25 | 16.18 |
| Home Depot | 51.41 | 39.24 |
| JP Morgan Chase | 48.38 | 31.55 |
| Procter & Gamble | 69.51 | 65.21 |
| Verizon | 40.53 | 38.92 |
| Devon Energy | 72.82 | 59.60 |
| Lilly | 41.47 | 39.86 |
| Microsoft | 34.56 | 23.76 |
| Coco Cola | 75.91 | 68.87 |
| Qualcomm | 70.26 | 53.00 |
| Exxon Mobil | 89.53 | 82.56 |
| Pacific Gas & Electric | 24.25 | 19.14 |
| Oracle Systems | 31.06 | 23.08 |
| Chevron | 109.51 | 104.60 |
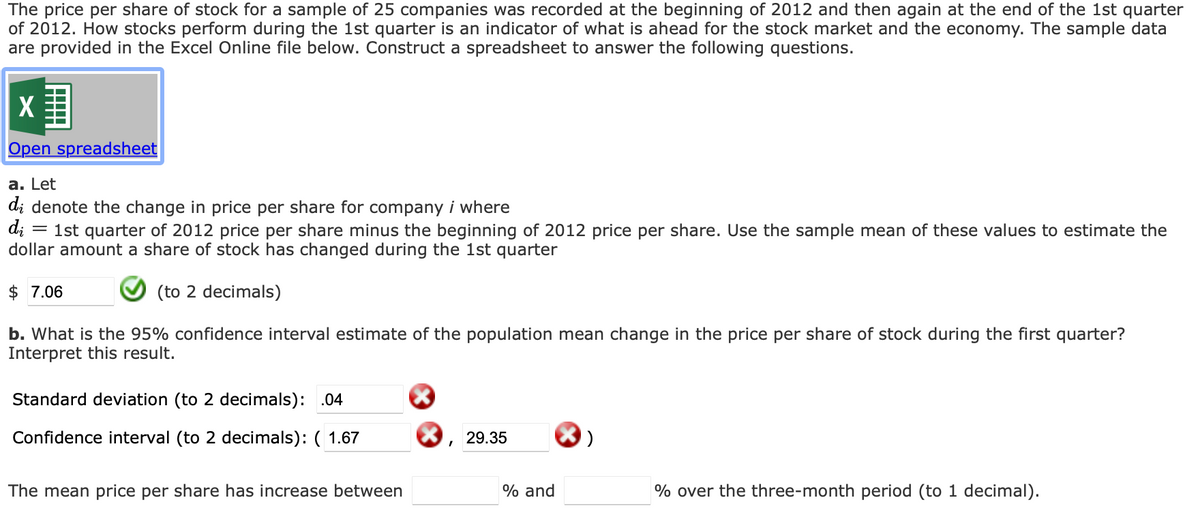

Transcribed Image Text:The price per share of stock for a sample of 25 companies was recorded at the beginning of 2012 and then again at the end of the 1st quarter
of 2012. How stocks perform during the 1st quarter is an indicator of what is ahead for the stock market and the economy. The sample data
are provided in the Excel Online file below. Construct a spreadsheet to answer the following questions.
X
Open spreadsheet
a. Let
di denote the change in price per share for company i where
d;
1st quarter of 2012 price per share minus the beginning of 2012 price per share. Use the sample mean of these values to estimate the
dollar amount a share of stock has changed during the 1st quarter
$ 7.06
(to 2 decimals)
b. What is the 95% confidence interval estimate of the population mean change in the price per share of stock during the first quarter?
Interpret this result.
Standard deviation (to 2 decimals): .04
Confidence interval (to 2 decimals): ( 1.67
29.35
The mean price per share has increase between
% and
% over the three-month period (to 1 decimal).
Expert Solution
This question has been solved!
Explore an expertly crafted, step-by-step solution for a thorough understanding of key concepts.

This is a popular solution

Trending nowThis is a popular solution!

Step by stepSolved in 3 steps

Knowledge Booster

Similar questions
- The table shows the annual compensation of 40 randomly chosen CEOS (millions of dollars). Saved 5.12 1.81 17.55 18.07 194.40 24.11 6.06 12.84 24.08 6.56 15.81 87.73 8.63 2.58 2.71 25.37 13.12 4.10 25.99 15.46 5.69 11.02 4.25 37.30 18.31 5.49 6.05 14.04 21.08 8.94 1.74 5.43 6.27 2.78 0.74 8.54 4.81 3.34 1.61 4.50 picture Click here for the Excel Data File (a) Select the correct histogram for the above data. Histogram A Histogram B Histogram 35 Histogram C Histogram 30 35 Histogram 25 30 40 35 20 25 30 15 20 25 15 20 10 15 10 0. 20 40 120 20 40 60 Compensation 120 60 80 180 20 Compensation 100 140 Compensation O Histogram A O Histogram B O Histogram C (b) Describe the shape of the histogram. Type here to search 83% Percent 10 09 08 180 Percent 80 140 Percent 120 180arrow_forwardA B C 7.98 5.09 9.18 14.22 9.45 17.9 14.88 9.92 18.83 10.35 6.75 12.5 16.52 11.07 21.13 23.46 15.92 30.84 14.02 9.31 17.63 14.55 9.68 18.37 8.65 5.56 10.11 18.49 12.44 23.89 9.94 6.46 11.92 21.16 14.31 27.62 12.41 8.19 15.38 18.1 12.17 23.34 11.45 7.51 14.03 20.54 13.87 26.75 17.2 11.54 22.09 14.35 9.55 18.09 15.41 10.29 19.58 13.08 8.65 16.31 13.14 8.7 16.4 18.47 12.43 23.85 21.47 14.53 28.06 17.13 11.49 21.98 14.93 9.95 18.9 9.89 6.43 11.85 13.63 9.04 17.08 9.75 6.32 11.65 15.74 10.52 20.04 27.14 18.5 36arrow_forwardPrice Lot size Trees Distance 105.4 41.2 24 42 91.2 44.8 5 71 183.3 21.3 72 43 93.8 43.9 58 14 207.5 57.7 52 12 130.9 33.4 78 26 162.3 31.4 65 51 18.8 27.4 22 0 80.5 26.2 68 83 38.3 40 57 76 71.3 47.6 53 35 55.5 31.6 36 26 85.7 21.6 23 24 110.5 36.3 48 98 85.1 47.2 61 59 78.3 30.5 41 55 27.2 41.8 1 60 70.9 20.6 20 33 101.4 35.3 38 75 133.3 40.1 68 0 117.7 35.6 24 41 49.7 20.6 16 77 49.6 22.4 32 86 83.2 45.8 77 19 81.3 29.4 40 0 152.5 51.7 60 34 112.2 27.2 0 16 37.1 37 50 49 130.2 38.9 48 63 39.1 32.5 25 45 81.9 34 12 0 24.6 35.8 16 34 101.9 32.9 44 42 117.6 46.4 62 48 148.8 51.9 59 39 60.2 28.9 0 66 43.7 35.2 57 77 113.1 30.4 70 78 38.1 38.3 24 62 89.2 49.2 61 0 3 21.5 46 83 55.8 41.9 10 69 89.7 21.8 79 62 136.1 66.3 56 34 44.7 28.2 73 77 63.2 41.9 64 65 163.4 46.7 69 27 64.1 32.1 12 0 98.7 38.5 59 77 139.9 27.6 0 0 92 47 65 37 66.6 20.7 24 51 16.4 34 12 75 131.9 31.9 76 63 11…arrow_forward
- Following are the quantities and prices for the years 2010 and 2018 for Kinzua Valley Geriatrics. Use 2010 as the base period. 2010 2018 Item Price Quantity Price Quantity Syringes (dozen) 6.22 1,220 6.64 1,065 Thermometers 8.54 12 15.64 10 Advil (bottle) 3.05 370 6.39 341 Patient record forms (box) 7.13 1,194 11.36 1,505 Copier paper (box) 12.27 33 14.56 58 d. Determine the Paasche price index. (Round your answer to 2 decimal places.) e. Determine Fisher's ideal index. (Round your answer to 2 decimal places.)arrow_forward4.764.724.744.554.914.744.784.714.804.784.784.754.794.824.914.834.684.744.704.804.704.764.704.834.934.744.844.824.764.774.724.784.834.754.744.684.844.714.714.764.664.784.734.744.924.774.804.794.864.644.784.704.754.784.764.834.664.774.834.784.694.814.684.784.884.724.854.854.814.744.804.824.844.704.854.704.814.724.794.63 What is the mean, median, and mode? (you may want to use your calculator or the average and median functions in Excel!) What could be some reasons for variation in the weights of the Kisses®? Note: Take time answering this one. There are lots of things to consider here and I'll be looking for a well thought out answer with several given reasons contributing to the variation. Of course, the wrappers and tags could vary but what about the drops of chocolate themselves? Why aren't they all the same? Would you say that there are any two Kisses that have exactly the same weight? (I mean exactly the same weight!) Explain why or why not. How many Kisses® were there in the…arrow_forwardThe following information is taken from Johnson & Johnson's annual reports. Its common stock is listed on the New York Stock Exchange, using the symbol JNJ. Year 2016 2017 2018 2019 2020 Year 2016 2017 Johnson & Johnson 2018 2019 2020 Domestic Sales International ($ million) Sales (5 million) 34,079 36,587 39,697 37,811 39,863 41,884 39,962 43,133 42,097 39,451 Click here for the Excel Data File Using the period 2016 to 2017 as the base period, compute a simple index of domestic sales for each year from 2018 to 2020. Note: Round your answers to 2 decimal places. The index (2016 to 2017= 100) for selected years is: Simple Index Employees (thousands) 126.4 134.0 135.1 132.2 135.5arrow_forward
- Household Paper Plastic 1 15.09 9.11 2 16.39 9.7 3 6.33 3.86 4 9.45 3.02 5 6.98 2.65 6 8.72 9.2 7 11.42 12.81 8 6.67 6.09 9 6.16 5.88 10 16.08 14.36 11 13.61 8.95 12 11.08 12.47 13 9.41 3.36 14 6.44 8.4 15 12.43 8.57 16 7.98 6.09 17 3.27 0.63 18 13.31 19.7 19 7.72 3.86 20 12.73 14.83 21 6.96 7.6 22 17.65 11.26 23 14.33 6.43 24 2.8 5.92 25 9.83 6.26 26 9.55 9.2 27 11.36 10.25 28 7.57 5.92 29 12.32 11.17 30 20.12 18.35arrow_forwardAaBb AaBbCcDdl Heading 1 Heading 2 Normal Title No Spacing Company Actual Estimated 0.38 2.31 AT&T 1.29 American Express Citigroup Coca-Cola Dupont Exxon-Mobil General Electric Johnson & Johnson McDonald's Wal-Mart 2.01 2.59 1.60 3.43 1.78 2.18 1.84 2.19 1.71 2.72 1.51 2.28 2.18 0.77 1.55 1.81 1.74 Total 18.42 19.45 Difference: 1.03 Use a level of significance of .05 and test for any difference between the population mean actual and population mean predicted earnings per share. What is the p-value? What is a. your conclusion? What is the point estimate of the difference between the two means? Did the analysts tend to underestimate or over estimate the earnings? b. At 95% confidence, what is the margin of error for the estimate in part b? What would you recommend based on this information? 8. English (United States) Focus 26 IG MacBook Air 20 F3 F2 F4 F5 F6 F7 F8 F9 F10 F11 23 & 4 8. 9.arrow_forwardThe table shows the annual compensation of 40 randomly chosen CEOS (millions of dollars). 5.54 1.88 17.40 15.42 12.03 13.03 25.31 25.19 25.79 20.28 20.74 7.31 7.45 6.23 4.61 6.44 13.90 10.15 9.10 8.15 8.94 5.82 192.84 84.66 25.86 33.46 2.61 2.66 1.22 3.95 15.58 4.79 3.71 4.56 4.33 4.33 4.79 2.06 0.93 1.29 Click here for the Excel Data File (a) Select the correct histogram for the above data. Histogram A Histogram B Histogram C Histogram 40 Histogram 35 40 Histogram 30 35 40 25 30 35 20 25 30 15 20 25 10 15 20 10 15 10 5 180 Compensation 120 180 120 140 160 180 Compensation Compensation O Histogram A O Histogram B O Histogram C (b) Describe the shape of the histogram. O The distribution is skewed to the right. O The distribution is symmetric. O The distribution is skewed to the left. ( Prev 5 of 19 Next > Percent Percent 140 091 Percentarrow_forward
arrow_back_ios
arrow_forward_ios
Recommended textbooks for you
- MATLAB: An Introduction with ApplicationsStatisticsISBN:9781119256830Author:Amos GilatPublisher:John Wiley & Sons Inc
 Probability and Statistics for Engineering and th...StatisticsISBN:9781305251809Author:Jay L. DevorePublisher:Cengage Learning
 Statistics for The Behavioral Sciences (MindTap C...StatisticsISBN:9781305504912Author:Frederick J Gravetter, Larry B. WallnauPublisher:Cengage Learning
  Elementary Statistics: Picturing the World (7th E...StatisticsISBN:9780134683416Author:Ron Larson, Betsy FarberPublisher:PEARSON
 The Basic Practice of StatisticsStatisticsISBN:9781319042578Author:David S. Moore, William I. Notz, Michael A. FlignerPublisher:W. H. Freeman
 Introduction to the Practice of StatisticsStatisticsISBN:9781319013387Author:David S. Moore, George P. McCabe, Bruce A. CraigPublisher:W. H. Freeman
MATLAB: An Introduction with Applications
Statistics
ISBN:9781119256830
Author:Amos Gilat
Publisher:John Wiley & Sons Inc
Probability and Statistics for Engineering and th...
Statistics
ISBN:9781305251809
Author:Jay L. Devore
Publisher:Cengage Learning
Statistics for The Behavioral Sciences (MindTap C...
Statistics
ISBN:9781305504912
Author:Frederick J Gravetter, Larry B. Wallnau
Publisher:Cengage Learning
Elementary Statistics: Picturing the World (7th E...
Statistics
ISBN:9780134683416
Author:Ron Larson, Betsy Farber
Publisher:PEARSON
The Basic Practice of Statistics
Statistics
ISBN:9781319042578
Author:David S. Moore, William I. Notz, Michael A. Fligner
Publisher:W. H. Freeman
Introduction to the Practice of Statistics
Statistics
ISBN:9781319013387
Author:David S. Moore, George P. McCabe, Bruce A. Craig
Publisher:W. H. Freeman