
MATLAB: An Introduction with Applications
6th Edition
ISBN: 9781119256830
Author: Amos Gilat
Publisher: John Wiley & Sons Inc
expand_more
expand_more
format_list_bulleted
Related questions
Topic Video
Question
An education researcher randomly assigns a group of 47 fourth grade students to receive a new after-school math program and 48 other fourth grade students to receive the standard after- school math program, and then measure how well they all do on a math test. Conduct a t-test!
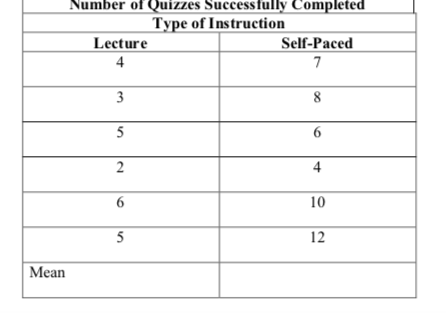

Transcribed Image Text:Number of Quizzes Successfully Completed
Type of Instruction
Lecture
Self-Paced
4
4
10
5
12
Mean
2.
Expert Solution
This question has been solved!
Explore an expertly crafted, step-by-step solution for a thorough understanding of key concepts.

This is a popular solution

Trending nowThis is a popular solution!

Step by stepSolved in 2 steps with 3 images

Knowledge Booster


Learn more about
Need a deep-dive on the concept behind this application? Look no further. Learn more about this topic, statistics and related others by exploring similar questions and additional content below.Similar questions
- Hi, please find the sample for each random number. choosing an odd number from 1 to 11 at random.arrow_forwardLast year 46% of business owners gave a holiday gift to their employees. A survey of business owners conducted this year indicated that 35% plan to provide a holiday gift to their employees. Suppose the survey results are based on a sample of 60 business owners. How many business owners in the survey plan to provide a holiday gift to their employees this year?arrow_forwardwould this be a one tail or two tail test?arrow_forward
- Claim: Most adults would erase all of their personal information online if they could. A software firm survey of 475 randomly selected adults showed that 57% of them would erase all of their personal information online if they could. Find the value of the test statistic.arrow_forwardA recent drug survey showed an increase in the use of drugs and alcohol among local high school seniors as compared to the national percent. Suppose that a survey of 100 local seniors and 100 national seniors is conducted to see if the proportion of drug and alcohol use is higher locally than nationally. Locally, 66 seniors reported using drugs or alcohol within the past month, while 62 national seniors reported using them. Conduct a hypothesis test at the 5% level. State the distribution to use for the test. What is the p-value?arrow_forwardA study has found that 85% of adults get their news on a mobile device. You randomly survey 35 adults and have found that 30 of them indeed get their news on a mobile device. What is the test statistic for this scenario? Round p to the hundredths place before completing your calculations.arrow_forward
- The CEO of a large electric utility claims that at least 80 percent of his one million customers are very satisfied with the service they receive. A local newspaper surveyed 300 customers randomly. 73 percent said they were very satisfied. The test statistic is (Round answer to two decimal places. Do not write 0.12 as .12.)arrow_forwardIn fall 2014, 34% of applicants with a Math SAT of 700 or more were admitted by a certain university, while 14% with a Math SAT of less than 700 were admitted. Further, 38% of all applicants had a Math SAT score of 700 or more. What percentage of admitted applicants had a Math SAT of 700 or more? (Round your answer to the nearest percentage point.) %arrow_forwardIn fall 2014, 38% of applicants with a Math SAT of 700 or more were admitted by a certain university, while 12% with a Math SAT of less than 700 were admitted. Further, 32% of all applicants had a Math SAT score of 700 or more. What percentage of admitted applicants had a Math SAT of 700 or more? (Round your answer to the nearest percentage point.)arrow_forward
- How do I answer/ start this? Which test do I use?arrow_forwardHow to find the values and find it in excelarrow_forwardAt a recent home football game, the Falcons surveyed fans to name their favorite Falcons player. What type of data was collected? Bivariate and Quantitative Bivariate and Categorical Univariate and Quantitative Univariate and Categoricalarrow_forward
arrow_back_ios
SEE MORE QUESTIONS
arrow_forward_ios
Recommended textbooks for you
- MATLAB: An Introduction with ApplicationsStatisticsISBN:9781119256830Author:Amos GilatPublisher:John Wiley & Sons Inc
 Probability and Statistics for Engineering and th...StatisticsISBN:9781305251809Author:Jay L. DevorePublisher:Cengage Learning
 Statistics for The Behavioral Sciences (MindTap C...StatisticsISBN:9781305504912Author:Frederick J Gravetter, Larry B. WallnauPublisher:Cengage Learning
  Elementary Statistics: Picturing the World (7th E...StatisticsISBN:9780134683416Author:Ron Larson, Betsy FarberPublisher:PEARSON
 The Basic Practice of StatisticsStatisticsISBN:9781319042578Author:David S. Moore, William I. Notz, Michael A. FlignerPublisher:W. H. Freeman
 Introduction to the Practice of StatisticsStatisticsISBN:9781319013387Author:David S. Moore, George P. McCabe, Bruce A. CraigPublisher:W. H. Freeman
MATLAB: An Introduction with Applications
Statistics
ISBN:9781119256830
Author:Amos Gilat
Publisher:John Wiley & Sons Inc
Probability and Statistics for Engineering and th...
Statistics
ISBN:9781305251809
Author:Jay L. Devore
Publisher:Cengage Learning
Statistics for The Behavioral Sciences (MindTap C...
Statistics
ISBN:9781305504912
Author:Frederick J Gravetter, Larry B. Wallnau
Publisher:Cengage Learning
Elementary Statistics: Picturing the World (7th E...
Statistics
ISBN:9780134683416
Author:Ron Larson, Betsy Farber
Publisher:PEARSON
The Basic Practice of Statistics
Statistics
ISBN:9781319042578
Author:David S. Moore, William I. Notz, Michael A. Fligner
Publisher:W. H. Freeman
Introduction to the Practice of Statistics
Statistics
ISBN:9781319013387
Author:David S. Moore, George P. McCabe, Bruce A. Craig
Publisher:W. H. Freeman