
MATLAB: An Introduction with Applications
6th Edition
ISBN: 9781119256830
Author: Amos Gilat
Publisher: John Wiley & Sons Inc
expand_more
expand_more
format_list_bulleted
Related questions
Question

Transcribed Image Text:Chrome File Edit View History
ail
C
Home-myRCC
Number of
People
10
9
8
7
6+
S
3-
2
mylearning.suny.edu/d21/le/content/920969/viewContent/25846458/View
1
x
Bookmarks
Submit Question
16-20
Profiles Tab Window Help
A.1 HW-23FA STATISTICS (81) X
비
26-30
31-35
Age
21-25
b Enter your payment details | ba x
Q
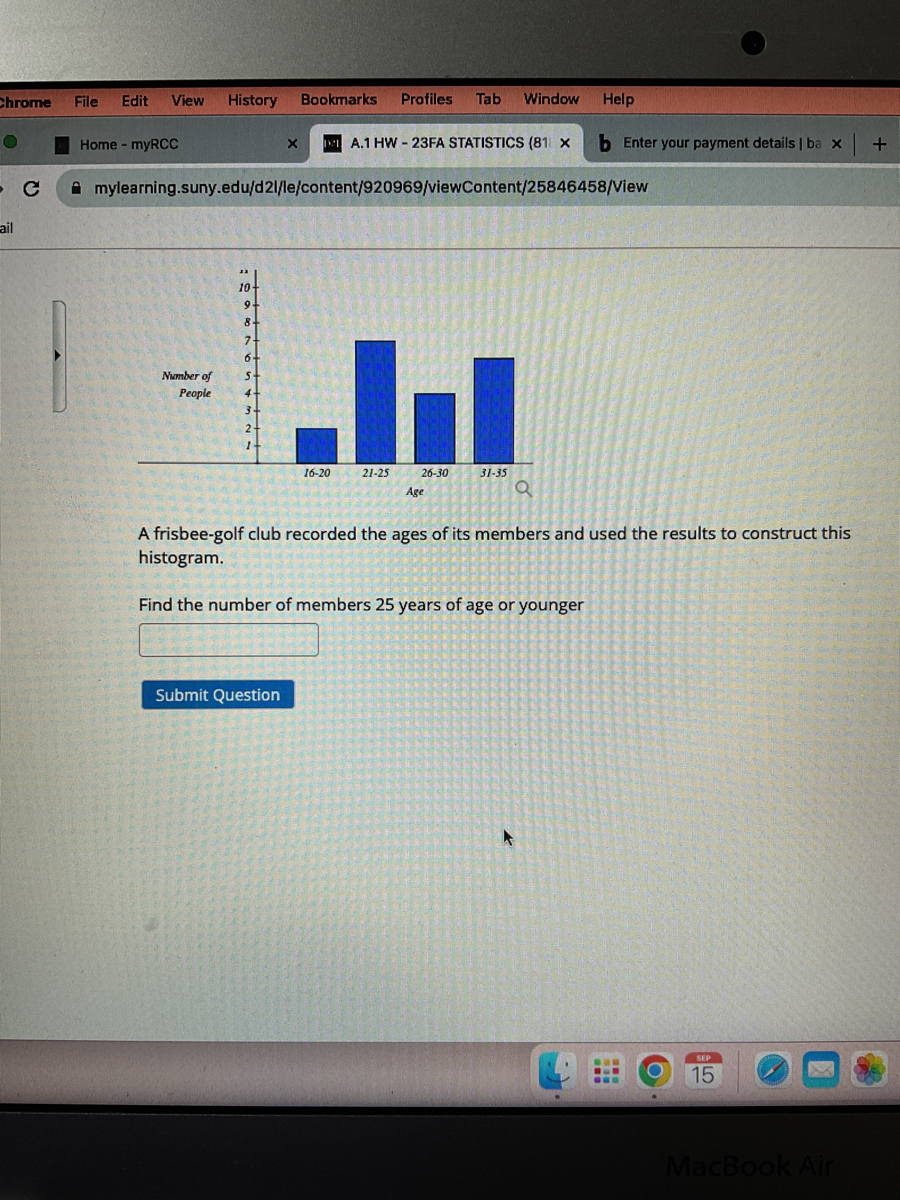
A frisbee-golf club recorded the ages of its members and used the results to construct this
histogram.
Find the number of members 25 years of age or younger
ㅅ
통일
---
●입점
SEP
15
MacBook Air
+
Expert Solution
This question has been solved!
Explore an expertly crafted, step-by-step solution for a thorough understanding of key concepts.

This is a popular solution

Trending nowThis is a popular solution!

Step by stepSolved in 3 steps with 1 images

Knowledge Booster

Similar questions
- Find the mean, median, and mode of the data set 9 4 8 4 7 mean (Enter a number.) median (Enter an exact number.) mode (Enter an exact number.)arrow_forwardFind the IQR ( Interquartile range) of the following data values: 35, 23, 12, 45, 31, 57, 61, 55, 36, 17arrow_forwardFind the 5 number summary of the following set of data: 11, 8, 12, 4, 7, 10, 3, 15, 8, 8, 7arrow_forward
- A student’s test grades are: 85, 75, 100, 90, and 90. On the two questions below, round to the nearest whole number when relevant. Show calculations and clearly report answers to each of the two questions below. a. What is the mean, or average, test grade for this student? b. What is the median test grade?arrow_forwardWhich of the following is a sample and not a population? People who live in your town People who respond to a national survey Patients admitted to Roper Hospital during March of 2006 Sixth grade boys attending Mount Hope elementary school.arrow_forwardFind the mean for the following group of data items. 5, 1, 8, 3, 4, 2, 5, 9 The mean is 4.63. (Type an integer or a decimal.)arrow_forward
- 7. Describe the shape of your data set by looking at the histogram. In your histogram how many classes are there? What is the class width?arrow_forwardWe have provided simple data sets for you to practice the basics of finding measures of center. For each data set, determine the a. mean. b. median. c. mode(s). 4, 2, 0, 2, 2arrow_forward
arrow_back_ios
arrow_forward_ios
Recommended textbooks for you
- MATLAB: An Introduction with ApplicationsStatisticsISBN:9781119256830Author:Amos GilatPublisher:John Wiley & Sons Inc
 Probability and Statistics for Engineering and th...StatisticsISBN:9781305251809Author:Jay L. DevorePublisher:Cengage Learning
 Statistics for The Behavioral Sciences (MindTap C...StatisticsISBN:9781305504912Author:Frederick J Gravetter, Larry B. WallnauPublisher:Cengage Learning
  Elementary Statistics: Picturing the World (7th E...StatisticsISBN:9780134683416Author:Ron Larson, Betsy FarberPublisher:PEARSON
 The Basic Practice of StatisticsStatisticsISBN:9781319042578Author:David S. Moore, William I. Notz, Michael A. FlignerPublisher:W. H. Freeman
 Introduction to the Practice of StatisticsStatisticsISBN:9781319013387Author:David S. Moore, George P. McCabe, Bruce A. CraigPublisher:W. H. Freeman
MATLAB: An Introduction with Applications
Statistics
ISBN:9781119256830
Author:Amos Gilat
Publisher:John Wiley & Sons Inc
Probability and Statistics for Engineering and th...
Statistics
ISBN:9781305251809
Author:Jay L. Devore
Publisher:Cengage Learning
Statistics for The Behavioral Sciences (MindTap C...
Statistics
ISBN:9781305504912
Author:Frederick J Gravetter, Larry B. Wallnau
Publisher:Cengage Learning
Elementary Statistics: Picturing the World (7th E...
Statistics
ISBN:9780134683416
Author:Ron Larson, Betsy Farber
Publisher:PEARSON
The Basic Practice of Statistics
Statistics
ISBN:9781319042578
Author:David S. Moore, William I. Notz, Michael A. Fligner
Publisher:W. H. Freeman
Introduction to the Practice of Statistics
Statistics
ISBN:9781319013387
Author:David S. Moore, George P. McCabe, Bruce A. Craig
Publisher:W. H. Freeman