Advanced Engineering Mathematics
10th Edition
ISBN: 9780470458365
Author: Erwin Kreyszig
Publisher: Wiley, John & Sons, Incorporated
expand_more
expand_more
format_list_bulleted
Question
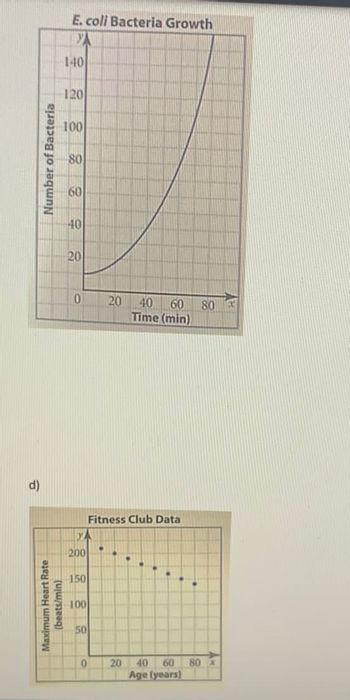
3. Describe the trend (e.g, increase or decrease)
Determine whether it shows a linear trend, quadratic trend or exponential trend (e.g. using
the first differences, second differences or decay or growth factor)

Transcribed Image Text:d)
Number of Bacteria
Maximum Heart Rate
(beats/min)
E. coli Bacteria Growth
YA
0
YA
0
20 40 60 80
Time (min)
Fitness Club Data
20 40 60 80 x
Age (years)
Expert Solution
This question has been solved!
Explore an expertly crafted, step-by-step solution for a thorough understanding of key concepts.
Step by stepSolved in 2 steps with 2 images

Knowledge Booster
Similar questions
- B3 Calculate (predict) t = 11 for each trend method. Create a Linear prediction for Federal Debt-GDP = Create an Exponential prediction for Federal Debt-GDP = Create a Polynomial (order 5) prediction for Federal Debt-GDP = Year t Federal Debt - GDP 2011 1 96.018 2012 2 100.061 2013 3 100.810 2014 4 102.818 2015 5 100.246 2016 6 105.337 2017 7 104.806 2018 8 105.632 2019 9 107.047 2020 10 128.332arrow_forwardA principal amount of $375 is placed in a savings account that earns 8% annual simple interest. Which graph best models the growth of the account balance.arrow_forwardEloise needs to finish a 516-page report on international trade so she can present it at the big conference this weekend. She's been tracking her page count at the end of each business day to see if she's on track. Use Excel to fit a trendline to Eloise's data to create a model of her productivity. According to your model, will Eloise be able to finish her report by the end of the day next Friday? Assume she works only on weekdays. Day Pages Monday 425 Tuesday 431 Wednesday 449 Thursday 464 Friday 471 A: Use Excel to fit a trendline to Eloise's data. What are the slope and intercept for this line? The slope is The intercept is B: Use your model (trendline) to answer the question. Will Eloise finish her report by the end of next friday? Yesarrow_forward
- II.arrow_forwardQ1: In what years were global temperatures the lowest? Q2: In what years were global temperatures the highest? Q3: What trend is apparent in this graph of actual global temperatures?arrow_forwardWhat shape best describes the graph of an exponential model? A. Straight line that is decreasing in value. B. A curve that starts rapidly but then grows slowly. C. A straight line that is increasing in value. D. A curve that starts slowly but then grows rapidly.arrow_forward
arrow_back_ios
arrow_forward_ios
Recommended textbooks for you
 Advanced Engineering MathematicsAdvanced MathISBN:9780470458365Author:Erwin KreyszigPublisher:Wiley, John & Sons, Incorporated
 Numerical Methods for EngineersAdvanced MathISBN:9780073397924Author:Steven C. Chapra Dr., Raymond P. CanalePublisher:McGraw-Hill Education
 Introductory Mathematics for Engineering Applicat...Advanced MathISBN:9781118141809Author:Nathan KlingbeilPublisher:WILEY
 Mathematics For Machine TechnologyAdvanced MathISBN:9781337798310Author:Peterson, John.Publisher:Cengage Learning,


Advanced Engineering Mathematics
Advanced Math
ISBN:9780470458365
Author:Erwin Kreyszig
Publisher:Wiley, John & Sons, Incorporated

Numerical Methods for Engineers
Advanced Math
ISBN:9780073397924
Author:Steven C. Chapra Dr., Raymond P. Canale
Publisher:McGraw-Hill Education

Introductory Mathematics for Engineering Applicat...
Advanced Math
ISBN:9781118141809
Author:Nathan Klingbeil
Publisher:WILEY

Mathematics For Machine Technology
Advanced Math
ISBN:9781337798310
Author:Peterson, John.
Publisher:Cengage Learning,

