
A First Course in Probability (10th Edition)
10th Edition
ISBN: 9780134753119
Author: Sheldon Ross
Publisher: PEARSON
expand_more
expand_more
format_list_bulleted
Related questions
Question

Transcribed Image Text:Ctrl
4.
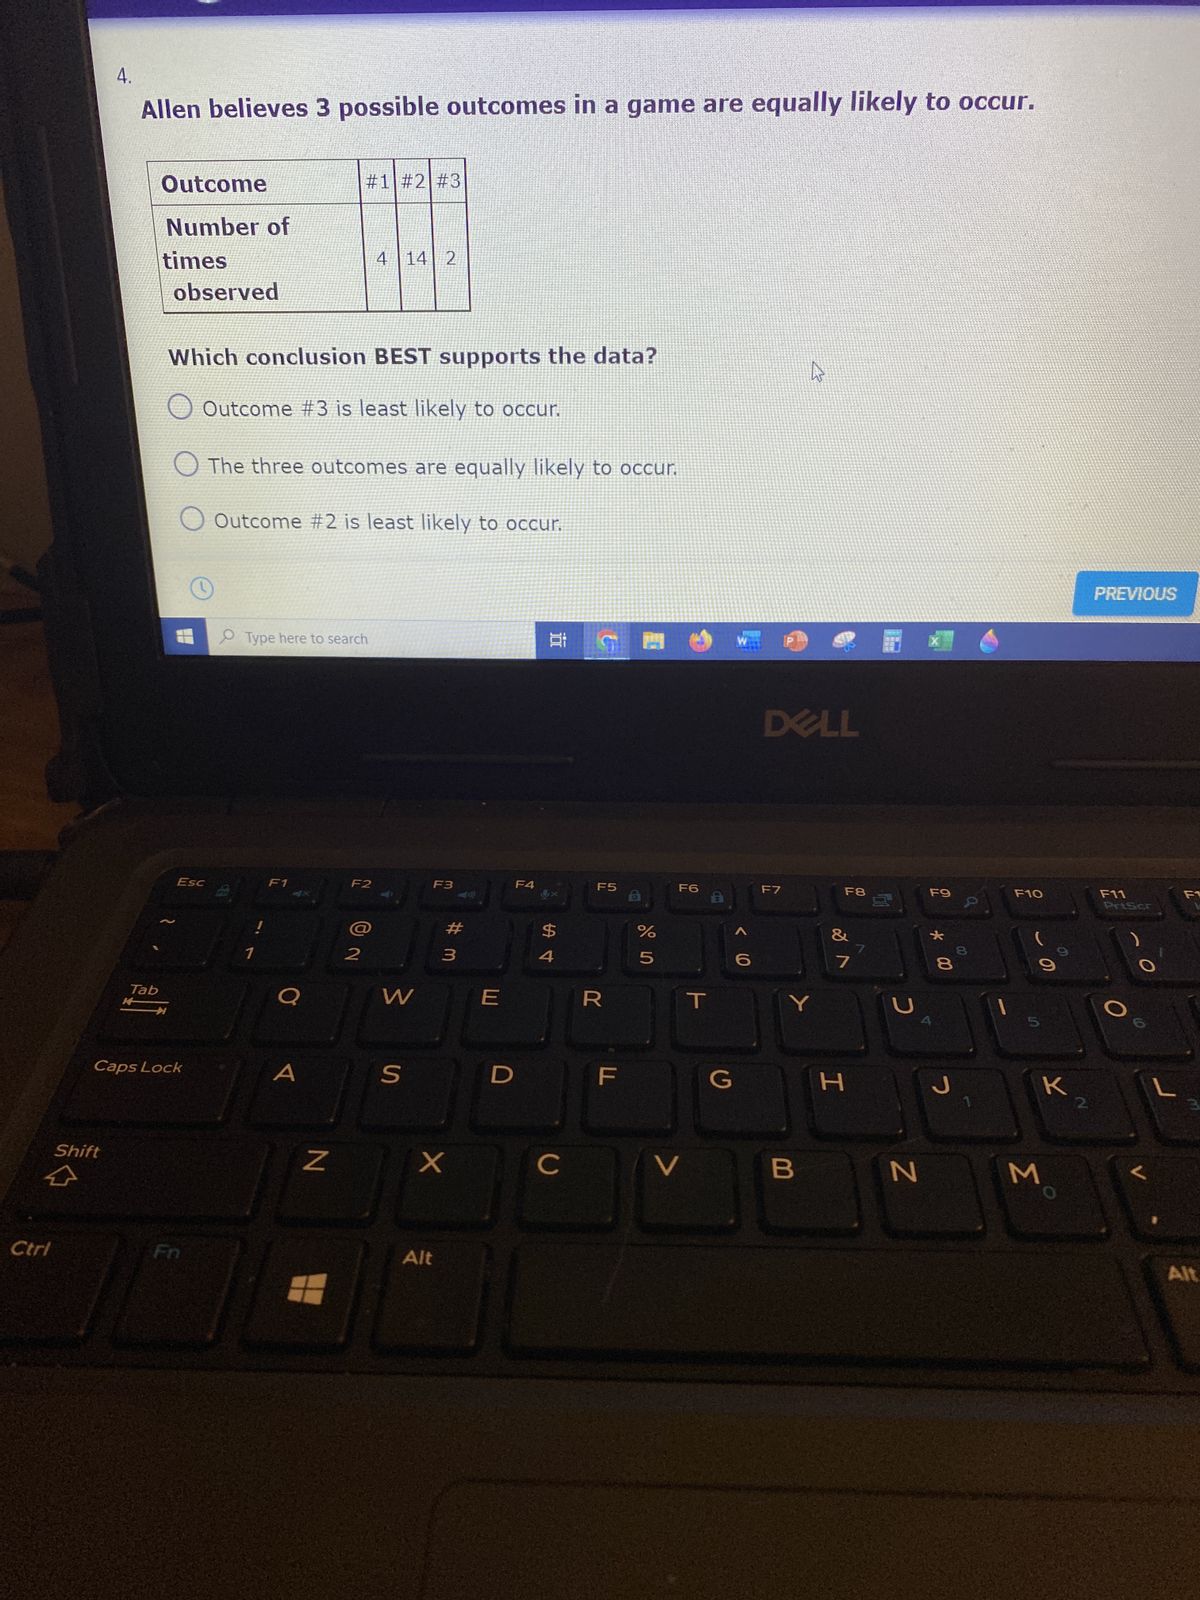
Allen believes 3 possible outcomes in a game are equally likely to occur.
Outcome
#1 #2 #3
Number of
times
4 14 2
observed
Which conclusion BEST supports the data?
A
Outcome #3 is least likely to occur.
The three outcomes are equally likely to occur.
O Outcome #2 is least likely to occur.
Type here to search
F1
F2
Shift
Esc
Tab
Caps Lock
!
2
W
S
F3
X
Z X
Alt
F4
E
100
#3
पं
$
C
F5
B
R
F
%
5
F6
V
T
G
1322
< 1.0
DELL
F7
F8
Y
B
7
H
7
с
F9
N
* 00
8
J
00
0
1
F10
60
M
K
2.
PREVIOUS
F11
PriScr
O
L
Alt
Expert Solution
This question has been solved!
Explore an expertly crafted, step-by-step solution for a thorough understanding of key concepts.

Step by stepSolved in 4 steps with 4 images

Knowledge Booster

Similar questions
- R3.23. Tips In restaurants, servers rely on tips as a major source of income. Does serving candy after the meal produce larger tips? To find out, two waiters determined randomly whether or not to give candy to 92 dining parties. They recorded the sizes of the tips and reported that guests getting candy tipped an average of 17.8% of the bill, compared with an average tip of only 15.1% from those who got no candy. ("Sweetening the Till: The Use of Candy to Increase Restaurant Tipping," Journal of Applied Social Psychology 32, no. 2 [2002]: 300-309) a) Was this an experiment or an observational study? Explain. b) Is it reasonable to conclude that the candy caused guests to tip more? Explain. c) The researchers said the difference was statistically sig- nificant. Explain in this context what that means.arrow_forwardQ1arrow_forwardTips It’s commonly believed that people use tips toreward good service. A researcher for the hospitalityindustry examined tips and ratings of service qualityfrom 2645 dining parties at 21 different restaurants. The correlation between ratings of service and tip percent-ages was 0.11. (M. Lynn and M. McCall, “Gratitude and Gratuity.” Journal of Socio-Economics 29: 203–214)a) Describe the relationship between Quality of Serviceand Tip Size.b) Find and interpret the value of R2 in this context.arrow_forward
- p value onlyarrow_forwardEspañol A decade-old study found that the proportion, p, of high school seniors who believed that "getting rich" was an important personal goal was 80%. A researcher decides to test whether or not that percentage still stands. He finds that, among the 240 high school seniors in his random sample, 185 believe that "getting rich" is an important goal. Can he conclude, at the 0.10 level of significance, that the proportion has indeed changed? Perform a two-tailed test. Then complete the parts below. SEE Carry your intermediate computations to three or more decimal places. (If necessary, consult a list of formulas.) 00 (a) State the null hypothesis H, and the alternative hypothesis H,. H, :0 H :0 (b) Determine the type of test statistic to use. O=0 OSO O20 (Choose one) (c) Find the value of the test statistic. (Round to three or more decimal places.) Oarrow_forwardR1arrow_forward
- (Use a=.05)arrow_forwardhelparrow_forward2 part question done in Excel. 1. Data are collected in a clinical trial evaluating a new compound designed to improve wound healing in trauma patients. The new compound is compared against a placebo. After treatment for 5 days with the new compound or placebo, the extent of the wound healing is measured and the date are show in the table below. Is there a difference in the extent of wound healing by treatment (Hint: Are treatment and the percent wound healing independent?) Run the appropriate tes at a 5% level of significance. 2. Use the data in Problem 1 and pool the data across the treatments into one sample of size n=250. Use the pooled data to test whether the distribution of the percent wound healing is approximately normal. Specifically, use the following distributions: 30%, 40%, 20%, and 10%. Run the appropriate test at a = 0.05.arrow_forward
arrow_back_ios
arrow_forward_ios
Recommended textbooks for you
- A First Course in Probability (10th Edition)ProbabilityISBN:9780134753119Author:Sheldon RossPublisher:PEARSON

A First Course in Probability (10th Edition)
Probability
ISBN:9780134753119
Author:Sheldon Ross
Publisher:PEARSON