MATLAB: An Introduction with Applications
6th Edition
ISBN: 9781119256830
Author: Amos Gilat
Publisher: John Wiley & Sons Inc
expand_more
expand_more
format_list_bulleted
Question

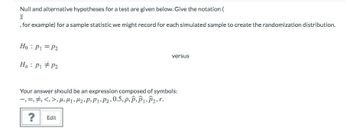
Transcribed Image Text:Null and alternative hypotheses for a test are given below. Give the notation (
X
, for example) for a sample statistic we might record for each simulated sample to create the randomization distribution.
Ho: P1 = P2
Ha P1 P2
versus
Your answer should be an expression composed of symbols:
—, , , <, >, M, M₁, M₂, P.P1 P2, 0.5, P.P.P1.P₂,r.
?
Edit
Expert Solution
This question has been solved!
Explore an expertly crafted, step-by-step solution for a thorough understanding of key concepts.
Step by stepSolved in 3 steps with 3 images

Knowledge Booster
Similar questions
- et's look at attendance between the two leagues and draw some conclusions. For purposes parts D and E, we are assuming that separating the data into 2 groups based on League is considered sampling; thus, we have 2 samples (American League and National League) and assume we do NOT know the population standard deviations for both "populations" (we only have 1 overall population, not 2). What was the average attendance in each league? Round your answer to 3 decimal places. American League average attendance mil National League average attendance mil space space Perform a hypothesis test to determine whether there is a difference in the mean attendance of teams in the American League vs teams in the National League. Use a 0.05 level of significance in your testing procedures. Additionally: You will need to know the standard deviations and variances for attendance in each league to conduct this test. We are assuming that both American and National League attendance…arrow_forwardStudents in a statistics course take their first exam and the class gets μ = 75.75 and σ = 7.75. The distribution is normally distributed (bell curve shaped). The professor takes all the scores and turns them into z-scores. What is true of the new z-score distribution that the professor has made? Group of answer choicesarrow_forwardUsing an evenly distributed data population of 8,000 samples, how many Would fall between a Z-score of -0.5 and +0.5? (blank)arrow_forward
- Textbook: Statistics for the Behavioral SciencesGregory J. Privitera Please show your work-Concept and Application Problems (Pg.133) An expert reviews a sample of 10 scientific articles (n = 10) and records the following number of errors in each article: 2, 9, 2, 8, 2, 3, 1, 0, 5, and 7. Compute the SS, variance, and standard deviation for this sample using the definitional and computational formula.arrow_forwardPlease help with this asaparrow_forwardPlease answer the last 2 questions.arrow_forward
arrow_back_ios
arrow_forward_ios
Recommended textbooks for you
 MATLAB: An Introduction with ApplicationsStatisticsISBN:9781119256830Author:Amos GilatPublisher:John Wiley & Sons Inc
 Probability and Statistics for Engineering and th...StatisticsISBN:9781305251809Author:Jay L. DevorePublisher:Cengage Learning
 Statistics for The Behavioral Sciences (MindTap C...StatisticsISBN:9781305504912Author:Frederick J Gravetter, Larry B. WallnauPublisher:Cengage Learning
 Elementary Statistics: Picturing the World (7th E...StatisticsISBN:9780134683416Author:Ron Larson, Betsy FarberPublisher:PEARSON
 The Basic Practice of StatisticsStatisticsISBN:9781319042578Author:David S. Moore, William I. Notz, Michael A. FlignerPublisher:W. H. Freeman
 Introduction to the Practice of StatisticsStatisticsISBN:9781319013387Author:David S. Moore, George P. McCabe, Bruce A. CraigPublisher:W. H. Freeman

MATLAB: An Introduction with Applications
Statistics
ISBN:9781119256830
Author:Amos Gilat
Publisher:John Wiley & Sons Inc

Probability and Statistics for Engineering and th...
Statistics
ISBN:9781305251809
Author:Jay L. Devore
Publisher:Cengage Learning

Statistics for The Behavioral Sciences (MindTap C...
Statistics
ISBN:9781305504912
Author:Frederick J Gravetter, Larry B. Wallnau
Publisher:Cengage Learning

Elementary Statistics: Picturing the World (7th E...
Statistics
ISBN:9780134683416
Author:Ron Larson, Betsy Farber
Publisher:PEARSON

The Basic Practice of Statistics
Statistics
ISBN:9781319042578
Author:David S. Moore, William I. Notz, Michael A. Fligner
Publisher:W. H. Freeman

Introduction to the Practice of Statistics
Statistics
ISBN:9781319013387
Author:David S. Moore, George P. McCabe, Bruce A. Craig
Publisher:W. H. Freeman