Note: Select and drag one or both of the curves to the desired position. Curves will snap into position, so if you try to move a curve and it snaps back to its original position, just drag it a little farther. 10 Supply Demand Supply Demand 2 16 24 32 40 QUANTITY (Millions of bushels) One of the growers is excited by this advancement because now she can sell more crops, which she believes will increase revenue in this market. As an economics student, you can use elasticities to determine whether this change in price will lead to an increase or decrease in total revenue in this market. Using the midpoint method, the price elasticity of demand for apples between the prices of $5 and $4 per bushel is , which means demand is between these two points. Therefore, you would tell the grower that her claim is because total revenue will as a result of the technological advancement. Confirm your previous conclusion by calculating total revenue in the apple market before and after the technological advancement. Enter these values in the following table. Before Technological Advancement After Technological Advancement Total Revenue (Millions of Dollars) PRICE (Dollars per bushel)
Note: Select and drag one or both of the curves to the desired position. Curves will snap into position, so if you try to move a curve and it snaps back to its original position, just drag it a little farther. 10 Supply Demand Supply Demand 2 16 24 32 40 QUANTITY (Millions of bushels) One of the growers is excited by this advancement because now she can sell more crops, which she believes will increase revenue in this market. As an economics student, you can use elasticities to determine whether this change in price will lead to an increase or decrease in total revenue in this market. Using the midpoint method, the price elasticity of demand for apples between the prices of $5 and $4 per bushel is , which means demand is between these two points. Therefore, you would tell the grower that her claim is because total revenue will as a result of the technological advancement. Confirm your previous conclusion by calculating total revenue in the apple market before and after the technological advancement. Enter these values in the following table. Before Technological Advancement After Technological Advancement Total Revenue (Millions of Dollars) PRICE (Dollars per bushel)

Chapter1: Making Economics Decisions
Section: Chapter Questions
Problem 1QTC

Related questions
Question
14. Application: Demand elasticity and agriculture
Consider the market for apples. The following graph shows the weekly demand for apples and the weekly supply of apples. Suppose new farming technology is developed that enables growers to produce more crops with the same resources.
Show the effect this shock has on the market for apples by shifting the demand curve, supply curve, or both.
Note: Select and drag one or both of the curves to the desired position. Curves will snap into position, so if you try to move a curve and it snaps back to its original position, just drag it a little farther.

Transcribed Image Text:Show the effect this shock has on the market for apples by shifting the demand curve, supply curve, or both.
Note: Select and drag one or both of the curves to the desired position. Curves will snap into position, so if you try to move a curve and it snaps back
to its original position, just drag it a little farther.
10
Supply
Demand
Supply
Demand
16
24
32
40
QUANTITY (Millions of bushels)
One of the growers is excited by this advancement because now she can sell more crops, which she believes will increase revenue in this market. As
an economics student, you can use elasticities to determine whether this change in price will lead to an increase or decrease in total revenue in this
market.
Using the midpoint method, the price elasticity of demand for apples between the prices of $5 and $4 per bushel is
which means demand is
between these two points. Therefore, you would tell the grower that her claim is
because total revenue will
as a result of the technological advancement.
Confirm your previous conclusion by calculating total revenue in the apple market before and after the technological advancement. Enter these values
in the following table.
Before Technological Advancement
After Technological Advancement
Total Revenue (Millions of Dollars)
PRICE (Dollars per bushel)
Expert Solution
Step 1
14) The technological shock would imply that the farmers are able to produce more of the goods with the same resources. This implies that they would be want to supply more as the cost per unit has now reduced.
This is a supply-side shock and hence the supply curve would be affected. The supply curve shifts to right.
The graph below shows the shift in the supply curve.
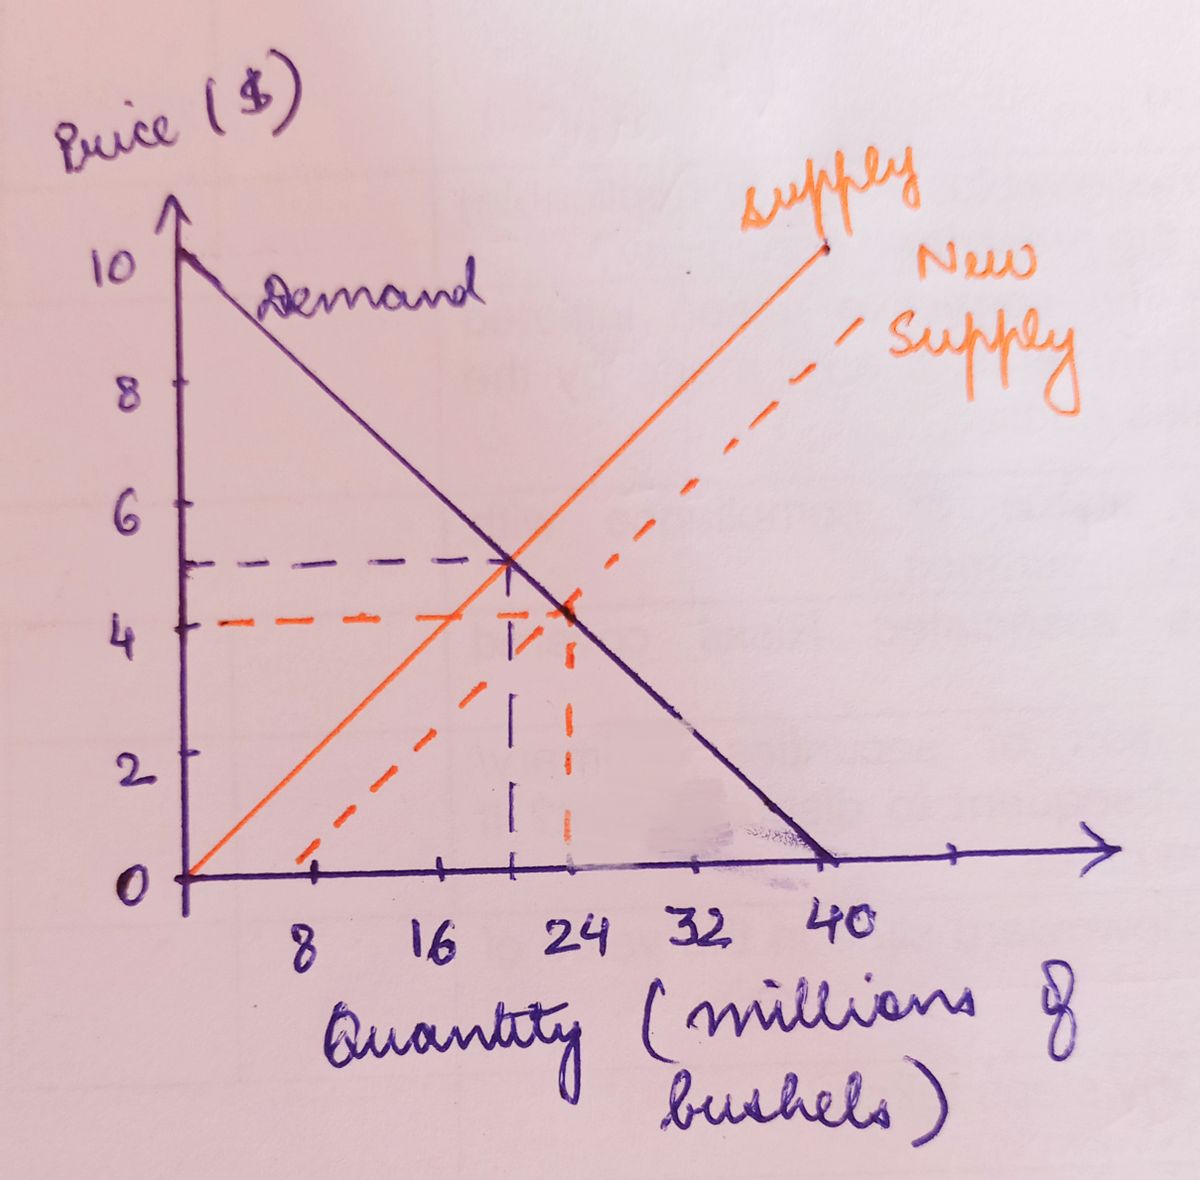
The dotted orange line denotes the new supply curve where the equilibrium price is $4 and quantity is 24.

Trending now
This is a popular solution!

Step by step
Solved in 3 steps with 1 images

Knowledge Booster


Learn more about
Need a deep-dive on the concept behind this application? Look no further. Learn more about this topic, economics and related others by exploring similar questions and additional content below.Recommended textbooks for you

Principles of Economics (12th Edition)
Economics
ISBN:
9780134078779
Author:
Karl E. Case, Ray C. Fair, Sharon E. Oster
Publisher:
PEARSON

Engineering Economy (17th Edition)
Economics
ISBN:
9780134870069
Author:
William G. Sullivan, Elin M. Wicks, C. Patrick Koelling
Publisher:
PEARSON
Principles of Economics (12th Edition)
Economics
ISBN:
9780134078779
Author:
Karl E. Case, Ray C. Fair, Sharon E. Oster
Publisher:
PEARSON
Engineering Economy (17th Edition)
Economics
ISBN:
9780134870069
Author:
William G. Sullivan, Elin M. Wicks, C. Patrick Koelling
Publisher:
PEARSON

Principles of Economics (MindTap Course List)
Economics
ISBN:
9781305585126
Author:
N. Gregory Mankiw
Publisher:
Cengage Learning

Managerial Economics: A Problem Solving Approach
Economics
ISBN:
9781337106665
Author:
Luke M. Froeb, Brian T. McCann, Michael R. Ward, Mike Shor
Publisher:
Cengage Learning

Managerial Economics & Business Strategy (Mcgraw-…
Economics
ISBN:
9781259290619
Author:
Michael Baye, Jeff Prince
Publisher:
McGraw-Hill Education