
MATLAB: An Introduction with Applications
6th Edition
ISBN: 9781119256830
Author: Amos Gilat
Publisher: John Wiley & Sons Inc
expand_more
expand_more
format_list_bulleted
Related questions
Question
Not understanding how they’re getting the p value

Transcribed Image Text:t value for
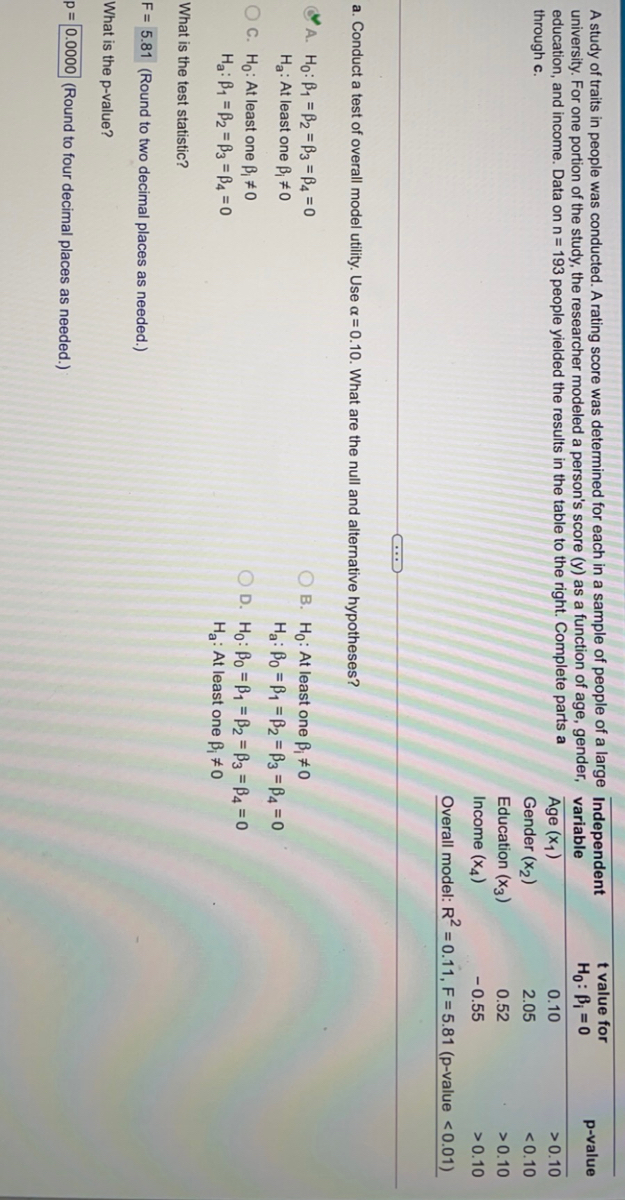
A study of traits in people was conducted. A rating score was determined for each in a sample of people of a large Independent
university. For one portion of the study, the researcher modeled a person's score (y) as a function of age, gender, variable
education, and income. Data on n= 193 people yielded the results in the table to the right. Complete parts a
through c.
p-value
Họ: B; = 0
Age (x1)
Gender (x2)
0.10
>0.10
2.05
<0.10
Education (x3)
Income (x4)
0.52
>0.10
- 0.55
>0.10
Overall model: R = 0.11, F = 5.81 (p-value <0.01)
a. Conduct a test of overall model utility. Use a = 0.10. What are the null and alternative hypotheses?
A. Ho: B1 = B2 = B3 =B4 = 0
O B. Ho: At least one ß, #0
Ha: Po = B1 = B2 = ß3 = B4 = 0
Ha: At least one B, #0
O C. Ho: At least one ß, #0
O D. Ho: Po = B1 = B2 = B3 = B4 = 0
Ha: At least one B; # 0
Ha: B1 = B2 = B3 = B4 = 0
What is the test statistic?
F = 5.81 (Round to two decimal places as needed.)
What is the p-value?
p= 0.0000 (Round to four decimal places as needed.)
Expert Solution
This question has been solved!
Explore an expertly crafted, step-by-step solution for a thorough understanding of key concepts.

Step by stepSolved in 2 steps

Knowledge Booster

Similar questions
- hii! can someone help me with this? thank you!!arrow_forwardReal estate again The regression of Price on Size ofhomes in Albuquerque had R2 = 71.4,, as describedin Exercise 25. Write a sentence (in context, of course)summarizing what the R2 says about this regression.arrow_forwardUsing bike weight to predict bike price what would be the response variable here?arrow_forward
arrow_back_ios
arrow_forward_ios
Recommended textbooks for you
- MATLAB: An Introduction with ApplicationsStatisticsISBN:9781119256830Author:Amos GilatPublisher:John Wiley & Sons Inc
 Probability and Statistics for Engineering and th...StatisticsISBN:9781305251809Author:Jay L. DevorePublisher:Cengage Learning
 Statistics for The Behavioral Sciences (MindTap C...StatisticsISBN:9781305504912Author:Frederick J Gravetter, Larry B. WallnauPublisher:Cengage Learning
  Elementary Statistics: Picturing the World (7th E...StatisticsISBN:9780134683416Author:Ron Larson, Betsy FarberPublisher:PEARSON
 The Basic Practice of StatisticsStatisticsISBN:9781319042578Author:David S. Moore, William I. Notz, Michael A. FlignerPublisher:W. H. Freeman
 Introduction to the Practice of StatisticsStatisticsISBN:9781319013387Author:David S. Moore, George P. McCabe, Bruce A. CraigPublisher:W. H. Freeman
MATLAB: An Introduction with Applications
Statistics
ISBN:9781119256830
Author:Amos Gilat
Publisher:John Wiley & Sons Inc
Probability and Statistics for Engineering and th...
Statistics
ISBN:9781305251809
Author:Jay L. Devore
Publisher:Cengage Learning
Statistics for The Behavioral Sciences (MindTap C...
Statistics
ISBN:9781305504912
Author:Frederick J Gravetter, Larry B. Wallnau
Publisher:Cengage Learning
Elementary Statistics: Picturing the World (7th E...
Statistics
ISBN:9780134683416
Author:Ron Larson, Betsy Farber
Publisher:PEARSON
The Basic Practice of Statistics
Statistics
ISBN:9781319042578
Author:David S. Moore, William I. Notz, Michael A. Fligner
Publisher:W. H. Freeman
Introduction to the Practice of Statistics
Statistics
ISBN:9781319013387
Author:David S. Moore, George P. McCabe, Bruce A. Craig
Publisher:W. H. Freeman