
MATLAB: An Introduction with Applications
6th Edition
ISBN: 9781119256830
Author: Amos Gilat
Publisher: John Wiley & Sons Inc
expand_more
expand_more
format_list_bulleted
Related questions
Concept explainers
Question
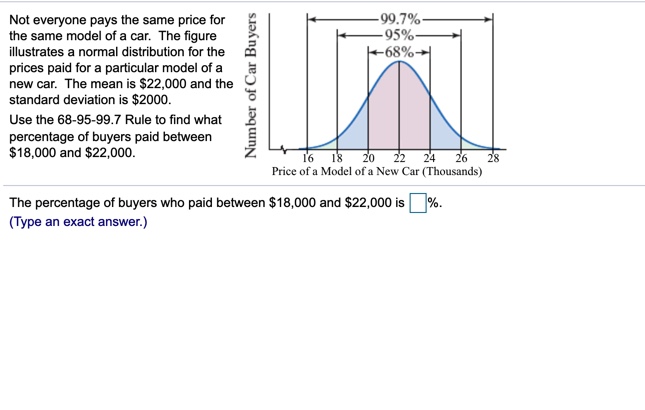

Transcribed Image Text:The image presents a study of car prices using a normal distribution graph. The graph showcases the prices paid for a particular model of a new car, where:
- The mean price is $22,000.
- The standard deviation is $2,000.
The graph visualizes the 68-95-99.7 Rule, also known as the Empirical Rule. According to this rule:
- 68% of data falls within one standard deviation (between $20,000 and $24,000).
- 95% of data falls within two standard deviations.
- 99.7% of data falls within three standard deviations.
In the graph, the area between $18,000 and $22,000 represents one standard deviation below the mean. This segment accounts for 34% of the data, as the total for one standard deviation (68%) is symmetrically divided.
Users are prompted to determine the percentage of buyers who paid between $18,000 and $22,000, which is explicitly 34%.
Expert Solution
This question has been solved!
Explore an expertly crafted, step-by-step solution for a thorough understanding of key concepts.

This is a popular solution

Trending nowThis is a popular solution!

Step by stepSolved in 2 steps

Knowledge Booster


Learn more about
Need a deep-dive on the concept behind this application? Look no further. Learn more about this topic, statistics and related others by exploring similar questions and additional content below.Similar questions
- The sample mean amount of savings is $arrow_forwardThe salaries of 1200 pro athletes form a normal distribution with a mean of $79,000 and a standard deviation of $30,000. A "superstar" is defined as anybody in the top 2% of the salary distribution. What is the minimum salary of a superstar? Select one: a. $85,150 b. $140,500 c. $209,000 O d. $109,000arrow_forwardDetermine whether the following graph can represent a variable with a nomal distribution. Explain your reasoning. If the graph appears to represent a normal distribution, estimate the mean and standard deviation. 10 15 20 25 30 Could the graph represent a variable with a normal distribution? Explain your reasoning. Select the correct choice below and, if necessary, fill in the answer boxes within your choice. O A. No, because the graph crosses the x-axis. O B. No, because the graph is skewed nght. O C. No, because the graph is skewed left. O D. Yes, the graph fulfills the properties of the normal distribution. The mean is approximately and the standard deviation is about- (Type whole numbers.) Clear all Final chec Help me solve this View an example Get more help -arrow_forward
- 1. In a sentence or two, explain what a sampling distribution is. 2. In a sentence or two explain how the standard error of the mean is similar to the standard deviation.arrow_forwardK A commuter tallied the time to work for 200 days and found that it resembled a normal curve. The mean time was 50 minutes, and the standard deviation was 2 minutes. For the 200-work-day experiment, find the percent of time commuting to work less than 44 minutes. 44 Minutes to Commute to Office 1 46 48 68%- 95% 99/7% 50arrow_forwardUsing technology, find the range and standard deviation, round to one decimals place:The table below gives the number of hours spent watching TV last week by a sample of 24 children. 20 39 34 29 48 84 64 25 75 89 40 57 82 43 62 52 49 59 38 87 49 66 95 17 Range = 78 Standard Deviation = 22.6arrow_forward
- (See photo) The data set on the left represents the annual rate of return (in percent) of eight randomly sampled bond mutual funds, and the data set on the right represents the annual rate of return (in percent) of eight randomly sampled stock mutual funds. What proportion of the observations is within one standard deviation of the mean for each data set?arrow_forwardFind and interpret the z-score for North Carolina.arrow_forwardThe table below summarizes the number of hours a sample of college students spent watching television in the past week. Hours Frequency 10 - 12 4 13 - 15 12 16 - 18 20 19 - 21 14 Find the standard deviation.arrow_forward
- A successful basketball player has a height of 6 feet 11 inches, or 211 cm. Based on statistics from a data set, his height converts to the z score of 5.17. How many standard deviations is his height above the mean?arrow_forwardFind the mean and standard deviation for the individualized instruction scores. Scores Individualized Instruction 50 - 59 4 60 – 69 8 70 - 79 6 80 - 89 8 90 - 99 3 Mean = (Round to the nearest hundredth.)arrow_forwardthe median of the following distribution: 10-14 15-19 16 20-24 12 25-29 4. TOTAL 40 O 20.00 O 17.00 O 14.50 O 18.25 Chek Save and Submit to save and submit. Click Save All Answers to savarrow_forward
arrow_back_ios
SEE MORE QUESTIONS
arrow_forward_ios
Recommended textbooks for you
- MATLAB: An Introduction with ApplicationsStatisticsISBN:9781119256830Author:Amos GilatPublisher:John Wiley & Sons Inc
 Probability and Statistics for Engineering and th...StatisticsISBN:9781305251809Author:Jay L. DevorePublisher:Cengage Learning
 Statistics for The Behavioral Sciences (MindTap C...StatisticsISBN:9781305504912Author:Frederick J Gravetter, Larry B. WallnauPublisher:Cengage Learning
  Elementary Statistics: Picturing the World (7th E...StatisticsISBN:9780134683416Author:Ron Larson, Betsy FarberPublisher:PEARSON
 The Basic Practice of StatisticsStatisticsISBN:9781319042578Author:David S. Moore, William I. Notz, Michael A. FlignerPublisher:W. H. Freeman
 Introduction to the Practice of StatisticsStatisticsISBN:9781319013387Author:David S. Moore, George P. McCabe, Bruce A. CraigPublisher:W. H. Freeman
MATLAB: An Introduction with Applications
Statistics
ISBN:9781119256830
Author:Amos Gilat
Publisher:John Wiley & Sons Inc
Probability and Statistics for Engineering and th...
Statistics
ISBN:9781305251809
Author:Jay L. Devore
Publisher:Cengage Learning
Statistics for The Behavioral Sciences (MindTap C...
Statistics
ISBN:9781305504912
Author:Frederick J Gravetter, Larry B. Wallnau
Publisher:Cengage Learning
Elementary Statistics: Picturing the World (7th E...
Statistics
ISBN:9780134683416
Author:Ron Larson, Betsy Farber
Publisher:PEARSON
The Basic Practice of Statistics
Statistics
ISBN:9781319042578
Author:David S. Moore, William I. Notz, Michael A. Fligner
Publisher:W. H. Freeman
Introduction to the Practice of Statistics
Statistics
ISBN:9781319013387
Author:David S. Moore, George P. McCabe, Bruce A. Craig
Publisher:W. H. Freeman