A First Course in Probability (10th Edition)
10th Edition
ISBN: 9780134753119
Author: Sheldon Ross
Publisher: PEARSON
expand_more
expand_more
format_list_bulleted
Question

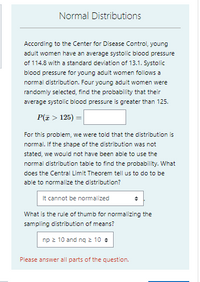
Transcribed Image Text:Normal Distributions
According to the Center for Disease Control, young
adult women have an average systolic blood pressure
of 114.8 with a standard deviation of 13.1. Systolic
blood pressure for young adult women follows a
normal distribution. Four young adult women were
randomly selected, find the probability that their
average systolic blood pressure is greater than 125.
P(I > 125) =
For this problem, we were told that the distribution is
normal. If the shape of the distribution was not
stated, we would not have been able to use the
normal distribution table to find the probability. What
does the Central Limit Theorem tell us to do to be
able to normalize the distribution?
It cannot be normalized
What is the rule of thumb for normalizing the
sampling distribution of means?
np 2 10 and ng 2 10 +
Please answer all parts of the question.

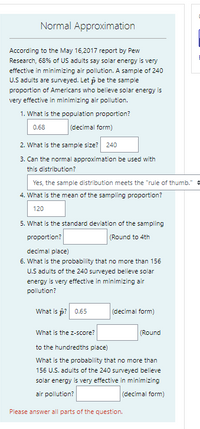
Transcribed Image Text:Normal Approximation
According to the May 16,2017 report by Pew
Research, 68% of US adults say solar energy is very
effective in minimizing air pollution. A sample of 240
U.S adults are surveyed. Let p be the sample
proportion of Americans who believe solar energy is
very effective in minimizing air pollution.
1. What is the population proportion?
0.68
(decimal form)
2. What is the sample size?
240
3. Can the normal approximation be used with
this distribution?
Yes, the sample distribution meets the "rule of thumb." +
4. What is the mean of the sampling proportion?
120
5. What is the standard deviation of the sampling
(Round to 4th
proportion?
decimal place)
6. What is the probability that no more than 156
U.S adults of the 240 surveyed believe solar
energy is very effective in minimizing air
pollution?
What is p? 0.65
(decimal form)
What is the z-score?
(Round
to the hundredths place)
What is the probability that no more than
156 U.S. adults of the 240 surveyed believe
solar energy is very effective in minimizing
air pollution?
(decimal form)
Please answer all parts of the question.
Expert Solution
This question has been solved!
Explore an expertly crafted, step-by-step solution for a thorough understanding of key concepts.
This is a popular solution
Trending nowThis is a popular solution!
Step by stepSolved in 4 steps with 4 images

Knowledge Booster
Similar questions
- The IQ of highschool seniors is normally distributed with a mean of 100 and a standard deviation of 15. What is the probability that a sample of 15 students will have a sample mean less than 99. Give your answer to three decimal places and write as a proportion (i.e. between 0 and 1).arrow_forwardIn your work as a biomedical engineer, you need to better understand the distribution of adults' blood pressures. Specifically, you are interested in systolic blood pressure, which is a measure of pressure within arteries when a heart beats; this is the first number in a blood pressure reading. In healthy adults, systolic blood pressure has a normal distribution with a mean of 112 mm Hg and standard deviation of 10 mmHg. Before you collect sample data, you want to predict the range in which you expect almost all of the data to fall. Which of the following represents the interval that will likely contain almost all (~99.7%) of the sample measurements of healthy adult systolic blood pressure? A) (102 mm Hg, 122 mm Hg) B) (92 mm Hg, 132 mm Hg) C) (82 mm Hg, 142 mm Hg) D) (72 mm Hg, 152 mm Hg)arrow_forwardA normal distribution has a mean of 148 and a standard deviation of 5. Find the z-score for a data value of 136.arrow_forward
- A normal distribution has a mean of 140 and a standard deviation of 7. Find the z-score for a data value of 141.arrow_forwardAlmost all medical schools require applicants to take the Medical College Admission Test (MCAT). Scores on the MCAT are approximately Normal with a mean of 25 and a standard deviation of 6.5. If the School of Health Sciences interviews one WSSU student about their score on the MCAT. What is the probability that their score be between 21 and 30?arrow_forwardStudents visiting the cafeteria noticed that the diameters of donuts follow a normal distribution with a mean diameter of 3 inches and a standard deviation of 0.2 inches. Find the probability that a student will get a donut with diameter less than 3.2 inches. What is the 40th percentile for the diameters of donuts?arrow_forward
- Based on data from the National Health Board, weights of men are normally distributed with a mean of 178 lbs, and a standard deviation of 29 lbs. Find the probability that 20 randomly selected men will have a mean weight between 170 and 190.arrow_forwardThe annual per capita consumption of ice cream (in pounds) in the United States can be approximated by a normal distribution with mean of 20.7 Ibs and a standard deviation of 4.2 Ibs. Find the probability that the population consumes at most 10 lbs yearly? Answer in a complete sentence in context.arrow_forwardA fair coin is flipped 100 times . Find the mean and standard deviation for the number of tails for this distribution.arrow_forward
- The average height of women is 64 inches. The standard deviation is 2 inches. The heights have a normal distribution. Find the probability that a randomly selected woman is shorter 59 inches or taller than 68 inches.arrow_forwardAdult males have a mean weight of 179 lbs with a standard deviation of 29 lbs. Find the probability that a random sample of 36 men will have a mean weight less than 176 lbsarrow_forwardThe NJ Department of Health has reported the average life span of NJ residents is 81 years. If the standard deviation is σ = 4 years, what is the probability of a person living to at least 92 years of age?arrow_forward
arrow_back_ios
SEE MORE QUESTIONS
arrow_forward_ios
Recommended textbooks for you
 A First Course in Probability (10th Edition)ProbabilityISBN:9780134753119Author:Sheldon RossPublisher:PEARSON

A First Course in Probability (10th Edition)
Probability
ISBN:9780134753119
Author:Sheldon Ross
Publisher:PEARSON
