
MATLAB: An Introduction with Applications
6th Edition
ISBN: 9781119256830
Author: Amos Gilat
Publisher: John Wiley & Sons Inc
expand_more
expand_more
format_list_bulleted
Related questions
Question
I need help on these T/F questions.
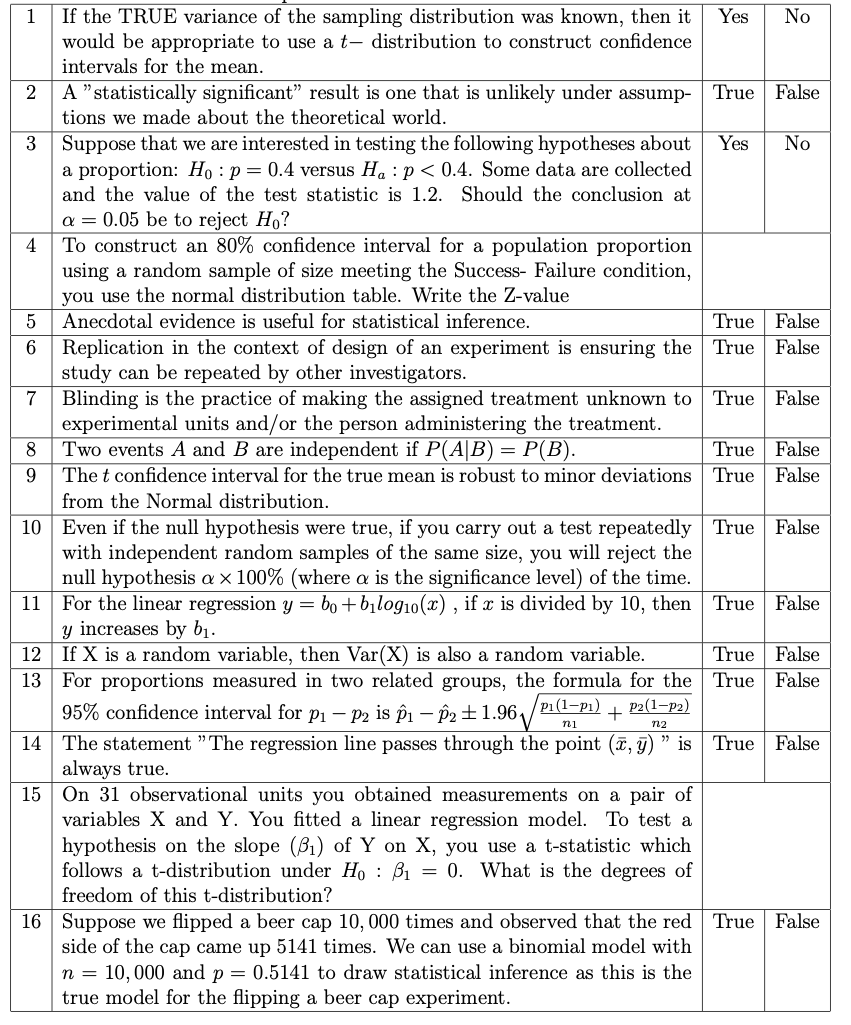

Transcribed Image Text:If the TRUE variance of the sampling distribution was known, then it
would be appropriate to use a t- distribution to construct confidence
intervals for the mean.
1
Yes
No
A "statistically significant" result is one that is unlikely under assump-
True
False
tions we made about the theoretical world.
Suppose that we are interested in testing the following hypotheses about
a proportion: Ho : p = 0.4 versus H. : p< 0.4. Some data are collected
and the value of the test statistic is 1.2. Should the conclusion at
Yes
No
a = 0.05 be to reject Ho?
To construct an 80% confidence interval for a population proportion
using a random sample of size meeting the Success- Failure condition,
you use the normal distribution table. Write the Z-value
Anecdotal evidence is useful for statistical inference.
Replication in the context of design of an experiment is ensuring the True False
study can be repeated by other investigators.
Blinding is the practice of making the assigned treatment unknown to
experimental units and/or the person administering the treatment.
Two events A and B are independent if P(A|B) = P(B).
The t confidence interval for the true mean is robust to minor deviations
4
True
False
7
True
False
8
True
False
9.
True False
from the Normal distribution.
10 Even if the null hypothesis were true, if you carry out a test repeatedly True
with independent random samples of the same size, you will reject the
null hypothesis a x 100% (where a is the significance level) of the time.
11 For the linear regression y = bo+ bịlog10(x), if x is divided by 10, then
y increases by b1.
12 If X is a random variable, then Var(X) is also a random variable.
13 For proportions measured in two related groups, the formula for the True | False
95% confidence interval for p1 – P2 is ĝi – P2 ±1.96/
False
True
False
True
False
P1 (1-p1)
P2(1-p2)
n2
14 The statement "The regression line passes through the point (7, j) " is True False
always true.
15 On 31 observational units you obtained measurements on a pair of
variables X and Y. You fitted a linear regression model. To test a
hypothesis on the slope (B1) of Y on X, you use a t-statistic which
follows a t-distribution under Ho : B1 = 0. What is the degrees of
freedom of this t-distribution?
16 Suppose we flipped a beer cap 10, 000 times and observed that the red True
side of the cap came up 5141 times. We can use a binomial model with
n = 10,000 and p = 0.5141 to draw statistical inference as this is the
true model for the flipping a beer cap experiment.
False
Expert Solution
This question has been solved!
Explore an expertly crafted, step-by-step solution for a thorough understanding of key concepts.

Step by stepSolved in 2 steps with 2 images

Knowledge Booster

Similar questions
- Ocean currents are important in studies of climate change, as well as ecology studies of dispersal of plankton. Drift bottles are used to study ocean currents in the Pacific near Hawaii, the Solomon Islands, New Guinea, and other islands. Let x represent the number of days to recovery of a drift bottle after release and y represent the distance from point of release to point of recovery in km/100. The following data are representative of one study using drift bottles to study ocean currents. x days y km/100 71 76 31 92 203 14.2 19.6 5.8 11.2 35.9 (a) Verify that Ex = 473, Ey = 86.7, Ex = 61,451, Ey = 2033.69, Exy = 10995.7, and r 0.93868. %3D %3D %3D %3D Σχ 1 473 ΣΥ| 86.7 Ex2 61451 Ey2 2033.69 Exy 10995.7 r0.93868 (b) Use a 1% level of significance to test the claim p > 0. (Use 2 decimal places.) t 4.72 critical t 4.54 Conclusion Reject the null hypothesis, there is sufficient evidence that p > 0. O Reject the null hypothesis, there is insufficient evidence that p > 0. Fail to reject…arrow_forwardCan you please analyse this for me. Step by step please.arrow_forwardCan you please analyse this for me. Step by step please.arrow_forward
- A high R2 is all that is needed to determine if a regression is a good model of a causal process. A. True B. Falsearrow_forwardThe average reading score on certain tests is given by y = 0.153x +255.33, where x is the number of years past 1970. In what year would the average reading = score be 258.849 if this model is accurate? The average reading score would be 258.849 in D 58 (Type a whole number.) CIJ #tv N N A ال / Nextarrow_forwardThere is a strong negative association between latitude (angular distance north or south of the Earth's equator) and skin cancer rates. (i) Does this mean that low latitudes cause skin cancer rates to increase? Explain your answer in one or two sentences.arrow_forward
- A researcher tested the relationship between gender and support for assisted suicide (“death with dignity”) and found a Cramer’s V of 0.45. This relationship is strong weak positive significant but not importantarrow_forwardplease answer question!arrow_forwardCan you please analyse this for me. Step by step please.arrow_forward
- You Got Gas have developed a new type of fuel additive that supposedly increases car speed. Before they put it out on the market, however, they need to test if it really is a difference compared to standard fuel. So, they took 6 vehicles and calculated the time it takes to for them to drive 1 mile going as fast as they can. They received the following data: Car ID# Course time (standard fuel in minutes) Course time (w/ additive in minutes) 1 35 27 2 40 35 3 25 27 4 40 39 5 95 94 6 32 18 6. What is the null and research hypothesis for this study? 7. What type of statistical test should we use to compare means (z-test, independent t-test, dependent t-test, or ANOVA)? Why? 8. What are the degrees of freedom? What are the critical values for that statistical test with this data at α = 0.05? α = 0.01? 9. Comparing the groups, is there a significant difference at α = 0.05 in lap time between eating the name bran and when they ate Dog Go? 10. How would the researcher…arrow_forwardAnswer D E Farrow_forward
arrow_back_ios
arrow_forward_ios
Recommended textbooks for you
- MATLAB: An Introduction with ApplicationsStatisticsISBN:9781119256830Author:Amos GilatPublisher:John Wiley & Sons Inc
 Probability and Statistics for Engineering and th...StatisticsISBN:9781305251809Author:Jay L. DevorePublisher:Cengage Learning
 Statistics for The Behavioral Sciences (MindTap C...StatisticsISBN:9781305504912Author:Frederick J Gravetter, Larry B. WallnauPublisher:Cengage Learning
  Elementary Statistics: Picturing the World (7th E...StatisticsISBN:9780134683416Author:Ron Larson, Betsy FarberPublisher:PEARSON
 The Basic Practice of StatisticsStatisticsISBN:9781319042578Author:David S. Moore, William I. Notz, Michael A. FlignerPublisher:W. H. Freeman
 Introduction to the Practice of StatisticsStatisticsISBN:9781319013387Author:David S. Moore, George P. McCabe, Bruce A. CraigPublisher:W. H. Freeman
MATLAB: An Introduction with Applications
Statistics
ISBN:9781119256830
Author:Amos Gilat
Publisher:John Wiley & Sons Inc
Probability and Statistics for Engineering and th...
Statistics
ISBN:9781305251809
Author:Jay L. Devore
Publisher:Cengage Learning
Statistics for The Behavioral Sciences (MindTap C...
Statistics
ISBN:9781305504912
Author:Frederick J Gravetter, Larry B. Wallnau
Publisher:Cengage Learning
Elementary Statistics: Picturing the World (7th E...
Statistics
ISBN:9780134683416
Author:Ron Larson, Betsy Farber
Publisher:PEARSON
The Basic Practice of Statistics
Statistics
ISBN:9781319042578
Author:David S. Moore, William I. Notz, Michael A. Fligner
Publisher:W. H. Freeman
Introduction to the Practice of Statistics
Statistics
ISBN:9781319013387
Author:David S. Moore, George P. McCabe, Bruce A. Craig
Publisher:W. H. Freeman