
MATLAB: An Introduction with Applications
6th Edition
ISBN: 9781119256830
Author: Amos Gilat
Publisher: John Wiley & Sons Inc
expand_more
expand_more
format_list_bulleted
Related questions
Concept explainers
Question
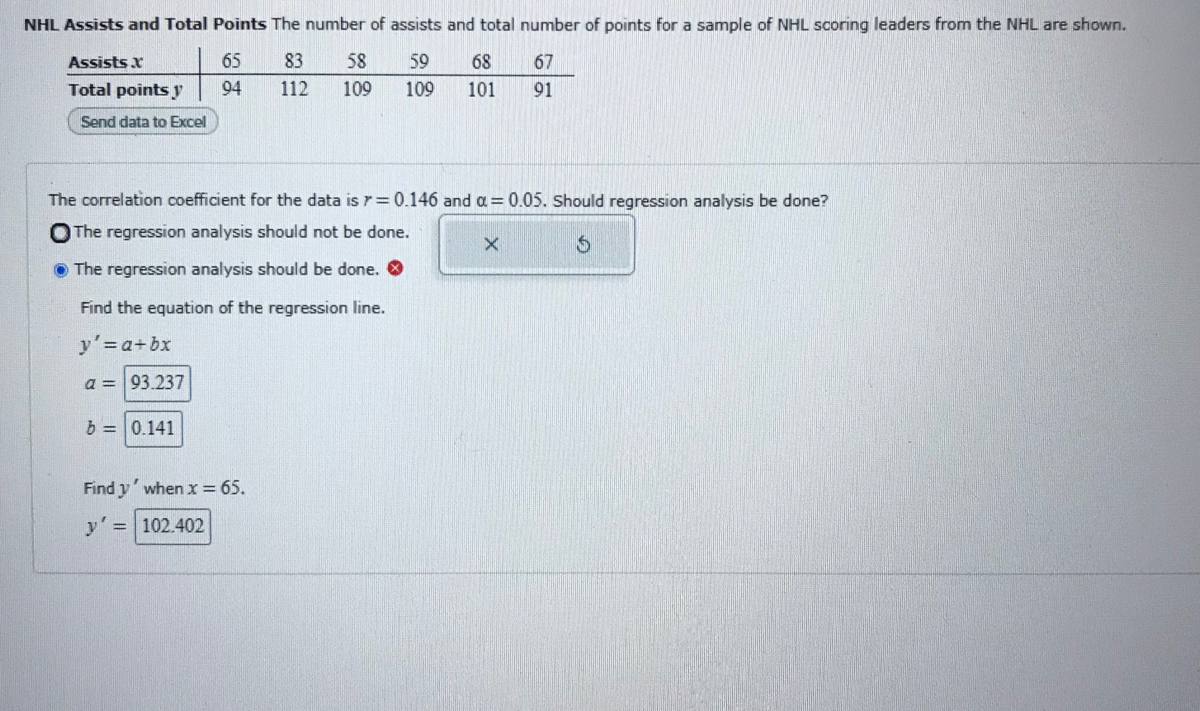

Transcribed Image Text:NHL Assists and Total Points The number of assists and total number of points for a sample of NHL scoring leaders from the NHL are shown.
Assists x
65
83
58
59
68
67
Total points y
94
112
109
109
101
91
Send data to Excel
The correlation coefficient for the data is r= 0.146 and a = 0.05. Should regression analysis be done?
OThe regression analysis should not be done.
O The regression analysis should be done. O
Find the equation of the regression line.
y'=a+bx
a = 93.237
b = 0.141
Find y' when x= 65.
y'= 102.402
Expert Solution
This question has been solved!
Explore an expertly crafted, step-by-step solution for a thorough understanding of key concepts.

This is a popular solution

Trending nowThis is a popular solution!

Step by stepSolved in 2 steps with 1 images

Knowledge Booster


Learn more about
Need a deep-dive on the concept behind this application? Look no further. Learn more about this topic, statistics and related others by exploring similar questions and additional content below.Similar questions
- At Bats and Hits The data below show the number of three-base hits (triples) and the number of home runs hit during the season by a random sample of MLB teams. Is there a significant relationship between the data? Triples 25 24 34 31 19 29 Home runs 312 236 301 279 276 270 Send data to Excel Part 1 of 5 Your Answer is correct (a) Draw the scatter plot for the variables. At Bats and Hits Home runs y 20 40 60 80 100 120 140 160 180 200 220 240 260 280 300 320 340 360 380 x 5 10 15 20 25 30 35 40 45 50 55 60 0 Triples Part: 1 / 5 1 of 5 Parts Complete Part 2 of 5 (b) Compute the value of the correlation coefficient. Round your answer to at least three decimal places. r=?arrow_forwardTriples and Home Runs The data below show the number of three-base hits (triples) and the number of home runs hit during the season by a random sample of MLB teams. Triples 33, 37, 27, 29, 18, 21 Home runs 305, 345, 245, 265, 155, 185 The correlation coefficient for the data is r= 1 and a=.01. Should regression analysis be done? The regression analysis should not be done or The regression analysis should be done. Find the equation of the regression line. Round the coefficients to at least three decimal places, if necessary y'= a+bx a= b= find y' when x= 28. Round the answer to at least three decimal places, if necessary y'=arrow_forwardFind the equation of the regression line for the given data. Then construct a scatter plot of the data and draw the regression line. (Each pair of variables has a significant correlation.) Then use the regression equation to predict the value of y for each of the given x-values, if meaningful. The caloric content and the sodium content (in milligrams) for 6 beef hot dogs are shown in the table below. Calories, x 150 180 130 120 90 190 (a) x=160 calories (b) x=100 calories Sodium, y 430 480 320 360 290 550 (c) x=140 calories (d) x=50 calories Find the regression equation. y=nothingx+(nothing) (Round to three decimal places as needed.) Choose the correct graph below. A. 02000560CaloriesSodium (mg) A scatterplot has a horizontal axis labeled "Calories" from 0 to 200 in increments of 20 and a vertical axis labeled "Sodium (in milligrams)" from 0 to 560 in increments of…arrow_forward
- The numbers of pass attempts and passing yards for seven professional quarterback for a recent year are listed in the table below. Round all answers to the nearest 1000th. Pass attempts (x) 449 565 528 197 670 351 218 Passing Yards (y) 3265 4018 3669 1141 5177 2362 1737 Calculate the sample correlation coefficient, r. Describe the type of correlation coefficient and interpret the correlation in the context of the data. Find the equation of the regression line for the data. Use the regression equation to predict the average number passing yards if the pass attempts are 250.arrow_forwardState Debt and Per Capita Taxes Data for per capita state debt and per capita state tax for five randomly selected states are shown. Per capita debt 4529 907 7554 2423 3357 Per capita tax 3478 2054 2818 1645 1430 Send data to Excel The correlation coefficient for the data is 7 0.563 and a= 0.05. Should regression analysis be done? OThe regression analysis should not be done. O The regression analysis should be done. Find the equation of the regression line. Round the coefficients to at least three decimal places, if necessary. y' a+bx a = b = Find y' when x = $1689. Round the answer to at least three decimal places, if necessary. v' =arrow_forwardTall Buildings The stories and heights (in feet) of a sample of 10 buildings in Pittsburgh are shown. Stories.x 64 54 40 31 45 44 42 41 39 40 Height y 741 625 535 516 515 482 435 420 411 385 Send data to Excel The correlation coefficient for the data is r= 0.788 and a= 0.05. Should regression analysis be done? O The regression analysis should not be done. O The regression analysis should be done. Find the equation of the regression line. Round the coefficients to at least three decimal places. y'=a+bx a = b = Find y' when x = 36. Round your answer to at least three decimal places. y'arrow_forward
arrow_back_ios
arrow_forward_ios
Recommended textbooks for you
- MATLAB: An Introduction with ApplicationsStatisticsISBN:9781119256830Author:Amos GilatPublisher:John Wiley & Sons Inc
 Probability and Statistics for Engineering and th...StatisticsISBN:9781305251809Author:Jay L. DevorePublisher:Cengage Learning
 Statistics for The Behavioral Sciences (MindTap C...StatisticsISBN:9781305504912Author:Frederick J Gravetter, Larry B. WallnauPublisher:Cengage Learning
  Elementary Statistics: Picturing the World (7th E...StatisticsISBN:9780134683416Author:Ron Larson, Betsy FarberPublisher:PEARSON
 The Basic Practice of StatisticsStatisticsISBN:9781319042578Author:David S. Moore, William I. Notz, Michael A. FlignerPublisher:W. H. Freeman
 Introduction to the Practice of StatisticsStatisticsISBN:9781319013387Author:David S. Moore, George P. McCabe, Bruce A. CraigPublisher:W. H. Freeman
MATLAB: An Introduction with Applications
Statistics
ISBN:9781119256830
Author:Amos Gilat
Publisher:John Wiley & Sons Inc
Probability and Statistics for Engineering and th...
Statistics
ISBN:9781305251809
Author:Jay L. Devore
Publisher:Cengage Learning
Statistics for The Behavioral Sciences (MindTap C...
Statistics
ISBN:9781305504912
Author:Frederick J Gravetter, Larry B. Wallnau
Publisher:Cengage Learning
Elementary Statistics: Picturing the World (7th E...
Statistics
ISBN:9780134683416
Author:Ron Larson, Betsy Farber
Publisher:PEARSON
The Basic Practice of Statistics
Statistics
ISBN:9781319042578
Author:David S. Moore, William I. Notz, Michael A. Fligner
Publisher:W. H. Freeman
Introduction to the Practice of Statistics
Statistics
ISBN:9781319013387
Author:David S. Moore, George P. McCabe, Bruce A. Craig
Publisher:W. H. Freeman