MATLAB: An Introduction with Applications
6th Edition
ISBN: 9781119256830
Author: Amos Gilat
Publisher: John Wiley & Sons Inc
expand_more
expand_more
format_list_bulleted
Question

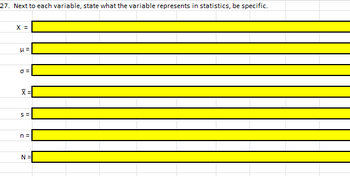
Transcribed Image Text:27. Next to each variable, state what the variable represents in statistics, be specific.
X =
μ=
0=
X =
S=
n =
N =

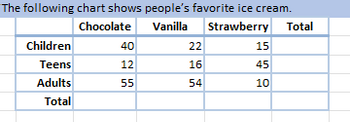
Transcribed Image Text:The following chart shows people's favorite ice cream.
Chocolate
Vanilla Strawberry Total
Children
Teens
Adults
Total
40
12
55
22
16
54
15
45
10
Expert Solution
arrow_forward
Part 1
X = The sample drawn from the population
= Population mean
= Standard deviation of the population
= Sample mean
Step by stepSolved in 2 steps

Knowledge Booster
Similar questions
- State the type of correlation between the number of hours students spend studying and the number of hours they spend watching television. Explain your answer.arrow_forwardUse your favorite search engine to find 10 daytime high temperatures from where you live. After obtaining this data, perform the following calculations from Week 9: • Mean • Median Mode Midrangearrow_forwardUse the data in the following table, which lists carbon dioxide concentrations (in parts per million) for each year from 1960 to 2009, with projected values used for the last four years. After finding the values of the mean and range for each decade, find the values of x,and R. Also find the values of LCL and UCL for an R chart, and find the values of LCL and UCL for an x chart. Atmospheric Carbon Dioxide Concentrations (in parts per million) 1960s 313.3 315.1 315.8 317.2 319.4 320.4 321.9 323.2 324.8 326.4 1970s 327.9 329.7 331.5 333.1 334.8 335.3 337.1 337.9 340.5 341.6 1980s 342.8 344.8 345.8 347.1 349.1 350.6 352.1 352.8 355.4 355.8 1990s 357.5 358.9 360.7 361.9 363.9 365.3 366.4 367.8 369.6 370.5 2000s 372.2 374.7 376.2 376.6 377.8 379.5 381.1 382.7 384.6 385.8 x=enter your response here (Round to three decimal places as needed.)…arrow_forward
- State whether you would expect the data set to be normally distributed.Amount of credit card debt of families in the U.S. Normal Not normalarrow_forwardA recent Nielsen analysis found that the typical U.S. smartphone user is spending an average of 220 minutes per day using apps. We speculate that the average time spent using apps for Generation X smartphone users (aged 41-56 years) is less than the national average. The hypotheses are Ho: H = 220 minutes versus Ha: µ < 220 minutes. Summary results from R are provided. Summary Statistics Std. Dev (s) Mean Sample Size (n) 205 minutes 63.25 minutes 31arrow_forwardRaymond wants to estimate the percentage of parents that use cloth diapers. He asks a randomly selected group of 200 parents whether or not they use cloth diapers. What is the data?arrow_forward
- For the data described, identify the level of measurement as nominal, ordinal, interval, or ratio. The years that different companies were started.arrow_forwardAfter giving a statistics exam, professor Dang determined the following five-number summary for her class results: 60 68 77 89 98. Use this information to draw a box plot of the exam scoresarrow_forwardDetermine whether the data are qualitative or quantitative. Cholesterol counts for individuals O Qualitative O Quantitativearrow_forward
- The number of hours per week that the television is turned on is determined for each family in a sample. The mean of the data is 3131 hours and the median is 27.227.2 hours. Twenty-four of the families in the sample turned on the television for 1616 hours or less for the week. The 7th percentile of the data is 1616 hours. What is the value of the 50th percentile?arrow_forwardFor each month of the year, Taylor collected the average high temperatures in Jackson, Mississippi. He used the data to create the histogram shown. Which set of data did he use to create the histogram?arrow_forwardFor each research question, explain what research design you would recommend. Also, identify how you would analyze the data. 1. A group who watches a scary movie will have the highest anxiety scores, followed by the group who watches science fiction. The group that watches a comedy will have the lowest anxiety scores.arrow_forward
arrow_back_ios
SEE MORE QUESTIONS
arrow_forward_ios
Recommended textbooks for you
 MATLAB: An Introduction with ApplicationsStatisticsISBN:9781119256830Author:Amos GilatPublisher:John Wiley & Sons Inc
 Probability and Statistics for Engineering and th...StatisticsISBN:9781305251809Author:Jay L. DevorePublisher:Cengage Learning
 Statistics for The Behavioral Sciences (MindTap C...StatisticsISBN:9781305504912Author:Frederick J Gravetter, Larry B. WallnauPublisher:Cengage Learning
 Elementary Statistics: Picturing the World (7th E...StatisticsISBN:9780134683416Author:Ron Larson, Betsy FarberPublisher:PEARSON
 The Basic Practice of StatisticsStatisticsISBN:9781319042578Author:David S. Moore, William I. Notz, Michael A. FlignerPublisher:W. H. Freeman
 Introduction to the Practice of StatisticsStatisticsISBN:9781319013387Author:David S. Moore, George P. McCabe, Bruce A. CraigPublisher:W. H. Freeman

MATLAB: An Introduction with Applications
Statistics
ISBN:9781119256830
Author:Amos Gilat
Publisher:John Wiley & Sons Inc

Probability and Statistics for Engineering and th...
Statistics
ISBN:9781305251809
Author:Jay L. Devore
Publisher:Cengage Learning

Statistics for The Behavioral Sciences (MindTap C...
Statistics
ISBN:9781305504912
Author:Frederick J Gravetter, Larry B. Wallnau
Publisher:Cengage Learning

Elementary Statistics: Picturing the World (7th E...
Statistics
ISBN:9780134683416
Author:Ron Larson, Betsy Farber
Publisher:PEARSON

The Basic Practice of Statistics
Statistics
ISBN:9781319042578
Author:David S. Moore, William I. Notz, Michael A. Fligner
Publisher:W. H. Freeman

Introduction to the Practice of Statistics
Statistics
ISBN:9781319013387
Author:David S. Moore, George P. McCabe, Bruce A. Craig
Publisher:W. H. Freeman