
MATLAB: An Introduction with Applications
6th Edition
ISBN: 9781119256830
Author: Amos Gilat
Publisher: John Wiley & Sons Inc
expand_more
expand_more
format_list_bulleted
Related questions
Question
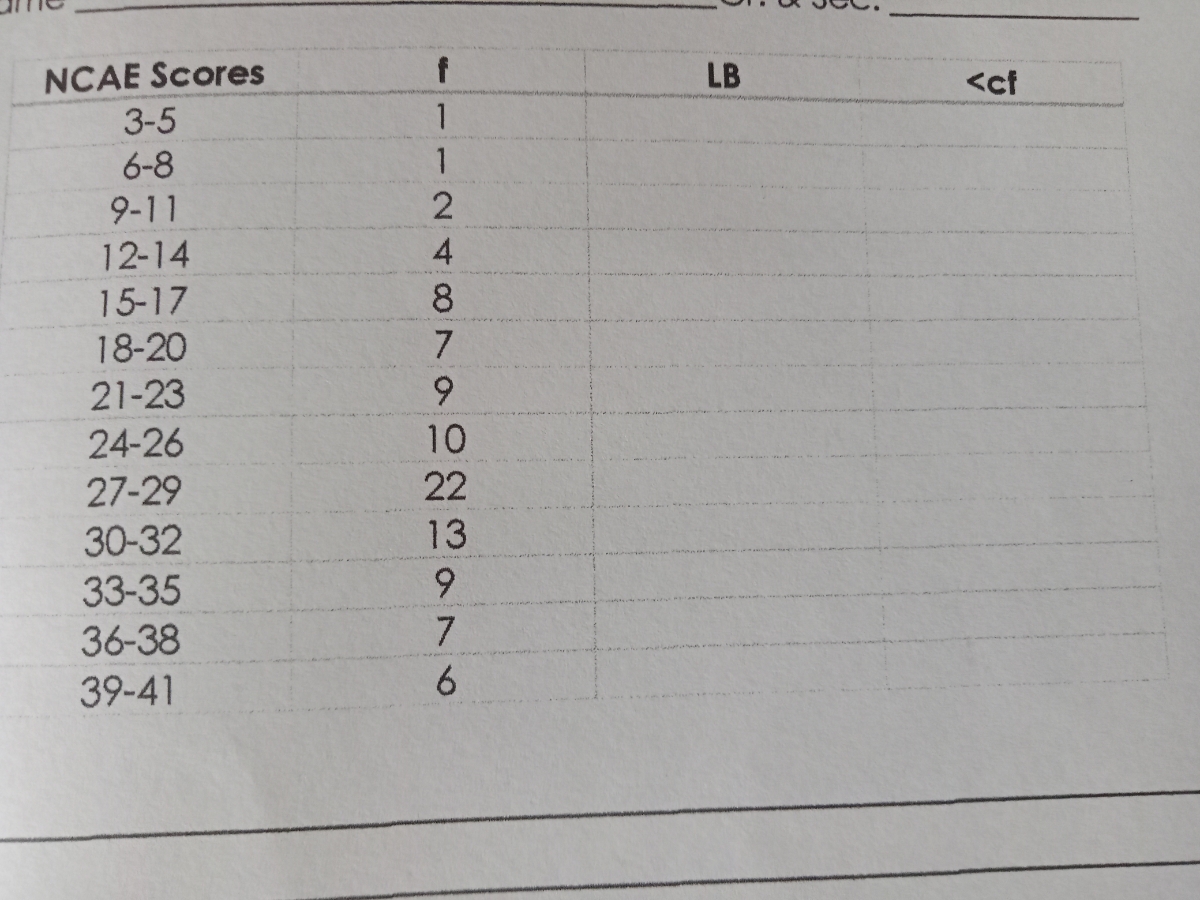

Transcribed Image Text:NCAE Scores
3-5
LB
<cf
1
6-8
1
9-11
2
12-14
4
15-17
8
18-20
21-23
6.
24-26
10
27-29
22
13
30-32
33-35
36-38
6.
39-41
6.
79
Expert Solution
This question has been solved!
Explore an expertly crafted, step-by-step solution for a thorough understanding of key concepts.

Step by stepSolved in 2 steps with 1 images

Knowledge Booster


Learn more about
Need a deep-dive on the concept behind this application? Look no further. Learn more about this topic, statistics and related others by exploring similar questions and additional content below.Similar questions
- The following set of data represents the number of orders filled by a national-chain restaurant during a two week period. Construct a five number summary for the the data. 66, 75, 68, 89, 86, 73, 67, 75, 75, 82, 85, 74, 67, 61 (Round to the nearest hundredth, if needed). Min _________________ Lower Quartile _________________ Median __________________ Upper Quartile _________________ Maximum __________________ What is the range and the interquartile range (IQR)? Range __________________ Interquartile Range (IQR) ___________________arrow_forwardApproximate the mean for following GFDT. Data Frequency 30 - 34 12 35 - 39 23 40 - 44 10 45 - 49 11 50 - 54 4 55 - 59 7 60 - 64 4 65 - 69 1 70 - 74 1 mean = Report answer accurate to one decimal place.arrow_forwardnumber of fruits spoiled frequency 0 3 1 14 2 11 3 9 4 9 5 2 6 2 7 3 14 1 25 1 build a steam and leaf chart with the information abovearrow_forward
- 0.11 vnosarrow_forwardWhat's the t= ? And the p-value?arrow_forwardNeed help with questions. Will give thumbs up! Data typed below and attached as an image. Non_Stop_Flights one_Stop_flights 1434.9 1556.2 1653.18 1549.33 1617.95 1511.14 1668.19 1497.84 1809.16 1882.04 1641.15 1600.5 1494.61 1699.01 1776.6 1582.12 1894.51 1502.09arrow_forward
- please answer in text form and in proper format answer with must explanation , calculation for each part and steps clearlyarrow_forwardEach box weighs the same. Which statement is TRUE when comparing the interquartile range (IQR) of the data? 38 32 32 33 29 28 27 26 25 23 Range = Max - Min IQR = Q3-Q1 Brand C Brand Darrow_forward???arrow_forward
arrow_back_ios
arrow_forward_ios
Recommended textbooks for you
- MATLAB: An Introduction with ApplicationsStatisticsISBN:9781119256830Author:Amos GilatPublisher:John Wiley & Sons Inc
 Probability and Statistics for Engineering and th...StatisticsISBN:9781305251809Author:Jay L. DevorePublisher:Cengage Learning
 Statistics for The Behavioral Sciences (MindTap C...StatisticsISBN:9781305504912Author:Frederick J Gravetter, Larry B. WallnauPublisher:Cengage Learning
  Elementary Statistics: Picturing the World (7th E...StatisticsISBN:9780134683416Author:Ron Larson, Betsy FarberPublisher:PEARSON
 The Basic Practice of StatisticsStatisticsISBN:9781319042578Author:David S. Moore, William I. Notz, Michael A. FlignerPublisher:W. H. Freeman
 Introduction to the Practice of StatisticsStatisticsISBN:9781319013387Author:David S. Moore, George P. McCabe, Bruce A. CraigPublisher:W. H. Freeman
MATLAB: An Introduction with Applications
Statistics
ISBN:9781119256830
Author:Amos Gilat
Publisher:John Wiley & Sons Inc
Probability and Statistics for Engineering and th...
Statistics
ISBN:9781305251809
Author:Jay L. Devore
Publisher:Cengage Learning
Statistics for The Behavioral Sciences (MindTap C...
Statistics
ISBN:9781305504912
Author:Frederick J Gravetter, Larry B. Wallnau
Publisher:Cengage Learning
Elementary Statistics: Picturing the World (7th E...
Statistics
ISBN:9780134683416
Author:Ron Larson, Betsy Farber
Publisher:PEARSON
The Basic Practice of Statistics
Statistics
ISBN:9781319042578
Author:David S. Moore, William I. Notz, Michael A. Fligner
Publisher:W. H. Freeman
Introduction to the Practice of Statistics
Statistics
ISBN:9781319013387
Author:David S. Moore, George P. McCabe, Bruce A. Craig
Publisher:W. H. Freeman