
A First Course in Probability (10th Edition)
10th Edition
ISBN: 9780134753119
Author: Sheldon Ross
Publisher: PEARSON
expand_more
expand_more
format_list_bulleted
Related questions
Question

Transcribed Image Text:**Blood Pressure Overview**
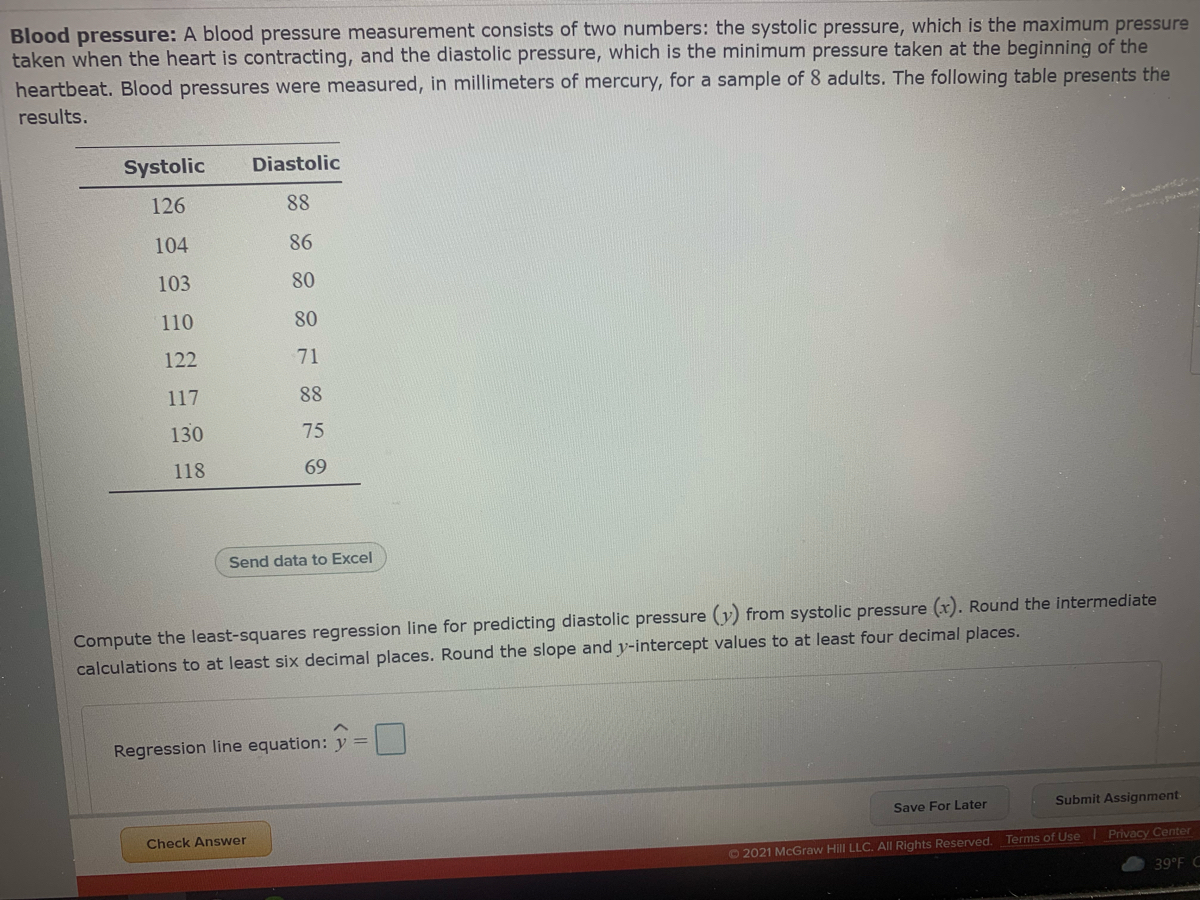
Blood pressure is measured in two numbers: the systolic and diastolic pressures.
- **Systolic Pressure:** This is the maximum pressure taken when the heart is contracting.
- **Diastolic Pressure:** This is the minimum pressure taken at the beginning of the heartbeat.
The table below shows blood pressure measurements, in millimeters of mercury, for a sample of 8 adults:
| Systolic | Diastolic |
|----------|-----------|
| 126 | 88 |
| 104 | 86 |
| 103 | 80 |
| 110 | 80 |
| 122 | 71 |
| 117 | 88 |
| 130 | 75 |
| 118 | 69 |
**Task**
Compute the least-squares regression line for predicting diastolic pressure (\(y\)) from systolic pressure (\(x\)). Round the intermediate calculations to at least six decimal places and round the slope and y-intercept values to at least four decimal places.
**Regression Line Equation**
Write the equation \(\hat{y} = \) and calculate the necessary coefficients to complete the regression model.
**Notes**
- The "Send data to Excel" feature can assist in the data analysis process.
- Ensure calculations are precise to facilitate accurate predictions.
**Additional Options**
- You can save your progress for later or submit the assignment when ready.
Expert Solution
This question has been solved!
Explore an expertly crafted, step-by-step solution for a thorough understanding of key concepts.

This is a popular solution

Trending nowThis is a popular solution!

Step by stepSolved in 2 steps with 2 images

Knowledge Booster

Similar questions
- 5°F oudy Find the third quartile for this list of numbers 17 97 67 56 27 57 76 89 9 90 25 14 52 92 21 Quartile 3 = Submit Question Q Searcharrow_forwardA sample of blood pressure measurements is taken for a group of adults, and those values (mm Hg) are listed below. The values are matched so that 10 subjects each have a systolic and diastolic measurement. Find the coefficient of variation for each of the two samples; then compare the variation. Systolic Diastolic116 78129 75160 7596 53157 90124 86114 60136 66128 74121 83arrow_forwardThe number of bpms (bits per microseconds) passed through a gate is given below. Find the median bpms. 70 60 50 61 78 32 73 28 39 19 63arrow_forward
- Find the margin of error for the given values of c, o, and n. c = 0.90, o = 2.4, n= 81 Click the icon to view a table of common critical values. E = (Round to three decimal places as needed.)arrow_forwardA new machine has just been installed to produce printed circuit boards. One of the critical measurements is the thickness of the resistance layer. The quality control inspector randomly selects five boards each half-hour, measures the thickness, and records the results. The measurements (in millimeters) for the period 8:00 a.m. to 10:30 a.m. follow. Thickness (millimeters) Time 1 2 3 4 5 8:00 87.2 87.3 87.9 87.0 87.0 8:30 86.9 88.5 87.6 87.5 87.4 9:00 87.8 88.6 86.8 87.7 88.2 9:30 86.0 88.0 87.2 87.6 87.1 10:00 86.8 87.0 86.9 87.3 87.3 10:30 88.0 86.2 87.4 87.1 87.9 Click here for the Excel Data Filea. Determine the control limits for the mean and the range. (Leave no cells blank - be certain to enter "0" wherever required. Round your answers to 2 decimal places.) Mean of the sample means = LCL = UCL = Mean of the sample ranges = LCL = UCL = c-1. Are any means out of control?multiple choice 1…arrow_forward1. Review the concept of normal curve. 2. Find the area under the normal curve. 3. Sketch the CURVE and SHADE THE REGION. Write your answer on your answer sheet. 7 Morales i X 1.x = 50 µ= 450=8 Find the area to the right. 2x=109 μ=1160=2.7 Find the area to the left. 3.X=12x2= 16 μ = 10 a = 5 Find the area in between.arrow_forward
- A sample of blood pressure measurements is taken for a group of adults, and those values (mm Hg) are listed below. The values are matched so that 10 subjects each have a systolic and diastolic measurement. Find the coefficient of variation for each of the two samples; then compare the variation. Systolic 117 128 158 94 158 120 114 138 124 1219 Diastolic 79 77 76 50 88 62 70 80 87 56 The coefficient of variation for the systolic measurements is %. (Type an integer or decimal rounded to one decimal place as needed.)arrow_forwardFind the margin of error for the given values of c, o, and n. c = 0.95, o = 2.7, n = 49 Click the icon to view a table of common critical values. E = (Round to three decimal places as needed.)arrow_forwardFind the margin of error for the given values of c, o, and n. c = 0.95, o = 3.6, n= 64 Click the icon to view a table of common critical values. E = (Round to three decimal places as needed.)arrow_forward
- count 5 L 40 50 3% O 5% 30% 60 (Assume left-hand endpoints are included in each bin.) What percentage of the class earned a C (scores of at least 70 but not 80 or more)? 33% 70 grades 80 I 90 100 O impossible to answer with this histogramarrow_forwardP. 38 What s the value of KL? 27 KLE54 inarrow_forwardFind the margin of error for the given values of c, o, and n. c= 0.90, o = 3.4, n= 36 Click the icon to view a table of common critical values. E = (Round to three decimal places as needed.)arrow_forward
arrow_back_ios
SEE MORE QUESTIONS
arrow_forward_ios
Recommended textbooks for you
- A First Course in Probability (10th Edition)ProbabilityISBN:9780134753119Author:Sheldon RossPublisher:PEARSON

A First Course in Probability (10th Edition)
Probability
ISBN:9780134753119
Author:Sheldon Ross
Publisher:PEARSON