
MATLAB: An Introduction with Applications
6th Edition
ISBN: 9781119256830
Author: Amos Gilat
Publisher: John Wiley & Sons Inc
expand_more
expand_more
format_list_bulleted
Related questions
Question
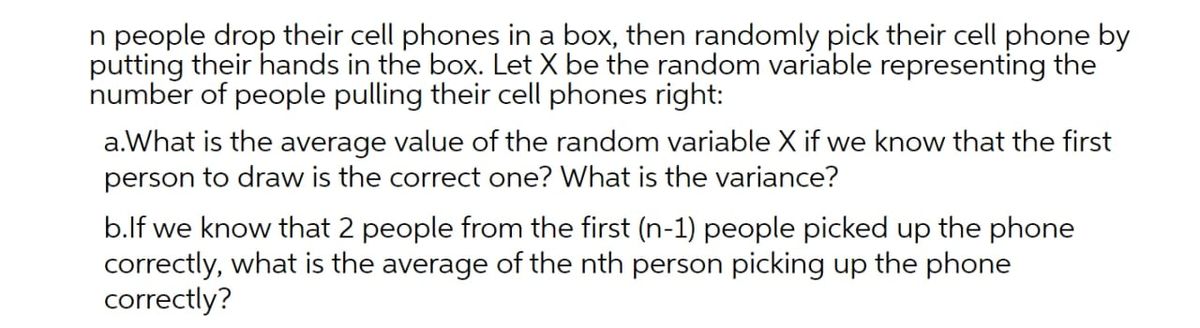

Transcribed Image Text:n people drop their cell phones in a box, then randomly pick their cell phone by
putting their hands in the box. Let X be the random variable representing the
number of people pulling their cell phones right:
a.What is the average value of the random variable X if we know that the first
person to draw is the correct one? What is the variance?
b.lf we know that 2 people from the first (n-1) people picked up the phone
correctly, what is the average of the nth person picking up the phone
correctly?
Expert Solution
This question has been solved!
Explore an expertly crafted, step-by-step solution for a thorough understanding of key concepts.

This is a popular solution

Trending nowThis is a popular solution!

Step by stepSolved in 3 steps with 2 images

Knowledge Booster

Similar questions
- Javier volunteers in community events each month. He does not do more than five events in a month. He attends exactly five events 35% of the time, four events 25% of the time, three events 20% of the time, two events 10% of the time, one event 5% of the time, and no events 5% of the time. a. Define the random variable X. b.What values does x take on? c. Construct aPDF table. d. Find the probability that Javier volunteers for less than three events each month. P(x 0) =.arrow_forwardYou are doing research on balance and fitness. To complete this research you will need a watch with a second hand. Identify a random sample of n = 12 men and n = 8 women. You must answer this question: How do you establish that this sample is truly random? Have each subject perform the following task: Have the subjects stand with their hands at their side, raise one knee, cross their ankle over the other knee, squat and bring their hands palms together in front of their chest. Time the subject until they put their foot back down on the floor. b)Ask the following questions: i)How many days per week do they exercise? ii) What is their favorite exercise? You will analyze your data and compute the following statistics for each group: 1) The Mean and standard deviation of the number of seconds the subject stayed balanced 2) The Median number of days per week exercised 3) The Mode of the favorite exercise 4) The 90% confidence interval of the mean 5) Construct a complete…arrow_forwardThe given information is available for two samples selected from independent normally distributed populations. Population A: n₁ = 28, s² = 168.4 Population B: n₂ = 28, S² = 139.8 How many degrees of freedom are there in the numerator and denominator of the F test? There are There are degrees of freedom in the numerator. degrees of freedom in the denominator.arrow_forward
- Three university administer the same comprehensive examination to the receipients of MS degree in Business Statistics. From each institution, a random sample of MS receipients was selected, and these receipients were then given to the exam. The following tabel shows the scores of each student from the three universities Uni A Uni B Uni C 89. 60. 81 95. 95. 70 75 89 90 92 80 78 99 66 77 At a= 0.01 , test to see if there is a significant difference in the average scores of students from the three universities Answer needed ASAP.arrow_forwardShow the probability distribution of the following using a chart and ahistogram: 20 out of 30 people at a party arenon-smokers. The random variable isthe number of smokers in a selection of4 partierarrow_forwardDelta limited the Chief Administrative Manager analyzed the number of incoming faxes. Afteran analysis, the manager determined the probability distribution of the number of pages per fax as follows:x1234567P(x)0.050.120.20.30.150.10.08Required:Compute the mean and the variance of the number of pages per fax.arrow_forward
- Anyone who has been outdoors on a summer evening has probably heard crickets. Did you know that it is possible to use the cricket as a thermometer? Crickets tend to chirp more frequently as temperatures increase. This phenomenon was studied in detail by George W. Pierce, a physics professor at Harvard. In the following data, x is a random variable representing chirps per second and y is a random variable representing temperature (°F). x 19.8 15.3 20.4 18.1 16.2 15.5 14.7 17.1 y 89.4 73.2 95.3 86.1 78.8 75.2 69.7 82.0 x 15.4 16.2 15.0 17.2 16.0 17.0 14.4 y 69.4 83.3 79.6 82.6 80.6 83.5 76.3 (b) Verify the given sums Σx, Σy, Σx2, Σy2, Σxy, and the value of the sample correlation coefficient r. (Round your value for r to three decimal places.) Σx = Σy = Σx2 = Σy2 = Σxy = r = (c) Find x, and y. Then find the equation of the least-squares line = a + bx. (Round your answers for x and y to two decimal places. Round your answers for a and…arrow_forwardWhat is assigned randomly?arrow_forwardYou are doing research on balance and fitness. To complete this research you will need a watch with a second hand. Identify a random sample of n = 12 men and n = 8 women. You must answer this question: How do you establish that this sample is truly random? Have each subject perform the following task: Have the subjects stand with their hands at their side, raise one knee, cross their ankle over the other knee, squat and bring their hands palms together in front of their chest. Time the subject until they put their foot back down on the floor. b) Ask the following questions: i) How many days per week do they exercise? ii) What is their favorite exercise? You will analyze your data and compute the following statistics for each group: 1) The Mean and standard deviation of the number of seconds the subject stayed balanced 2) The Median number of days per week exercised 3) The Mode of the favorite exercise 4) The 90% confidence interval of the mean Construct a complete…arrow_forward
- In regression analysis if a point has leverage then it must also be influential a true b falsearrow_forwardASK YOUR TEACHER Nationally, about 11% of the total U.S. wheat crop is destroyed each year by hail.t An insurance company is studying wheat hail damage claims in a county in Colorado. A random sample of 16 claims in the county reported the percentage of their wheat lost to hail. 14 7 10 11 12 19 14 11 9 8 23 19 13 7 10 7 The sample mean is x = 12.1%. Let x be a random variable that represents the percentage of wheat crop in that county lost to hail. Assume that x has a normal distribution and a = 5.0%. Do these data indicate that the percentage of wheat crop lost to hail in that county is different (either way) from the national mean of 11%? Use a = 0.01. (a) What is the level of significance? State the null and alternate hypotheses. Will you use a left-tailed, right-tailed, or two-tailed test? O Ho: H = 11%; H,: µ 11%; right-tailed O Ho: H + 11%; H,: u = 11%; two-tailed O Ho: H = 11%; H,: u + 11%; two-tailed (b) What sampling distribution will you use? Explain the rationale for your…arrow_forwardIn a survey conducted by a reputable marketing agency, 231 of 1000 adults 19 years of age or older confessed to bringing and using their cell phone every trip to the bathroom (confessions included texting and answering phone calls). Complete parts (a) through (f) below. D. The sample size is large. E. Its value may change depending on the individuals in the survey. What is the source of variability in the random variable? A. The sample size B. The individuals selected to be in the study C. The question asked in the survey D. The marketing agency (e) Construct and interpret a 95% confidence interval for the population proportion of adults 19 years of age or older who bring their cell phone every trip to the bathroom. Select the correct choice below and fill in any answer boxes within your choice. (Type integers or decimals rounded to three decimal places as needed. Use ascending order.) OA. There is a % probability the proportion of adults 19 years of age or older who bring their cell…arrow_forward
arrow_back_ios
SEE MORE QUESTIONS
arrow_forward_ios
Recommended textbooks for you
- MATLAB: An Introduction with ApplicationsStatisticsISBN:9781119256830Author:Amos GilatPublisher:John Wiley & Sons Inc
 Probability and Statistics for Engineering and th...StatisticsISBN:9781305251809Author:Jay L. DevorePublisher:Cengage Learning
 Statistics for The Behavioral Sciences (MindTap C...StatisticsISBN:9781305504912Author:Frederick J Gravetter, Larry B. WallnauPublisher:Cengage Learning
  Elementary Statistics: Picturing the World (7th E...StatisticsISBN:9780134683416Author:Ron Larson, Betsy FarberPublisher:PEARSON
 The Basic Practice of StatisticsStatisticsISBN:9781319042578Author:David S. Moore, William I. Notz, Michael A. FlignerPublisher:W. H. Freeman
 Introduction to the Practice of StatisticsStatisticsISBN:9781319013387Author:David S. Moore, George P. McCabe, Bruce A. CraigPublisher:W. H. Freeman
MATLAB: An Introduction with Applications
Statistics
ISBN:9781119256830
Author:Amos Gilat
Publisher:John Wiley & Sons Inc
Probability and Statistics for Engineering and th...
Statistics
ISBN:9781305251809
Author:Jay L. Devore
Publisher:Cengage Learning
Statistics for The Behavioral Sciences (MindTap C...
Statistics
ISBN:9781305504912
Author:Frederick J Gravetter, Larry B. Wallnau
Publisher:Cengage Learning
Elementary Statistics: Picturing the World (7th E...
Statistics
ISBN:9780134683416
Author:Ron Larson, Betsy Farber
Publisher:PEARSON
The Basic Practice of Statistics
Statistics
ISBN:9781319042578
Author:David S. Moore, William I. Notz, Michael A. Fligner
Publisher:W. H. Freeman
Introduction to the Practice of Statistics
Statistics
ISBN:9781319013387
Author:David S. Moore, George P. McCabe, Bruce A. Craig
Publisher:W. H. Freeman