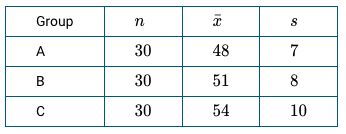
A bank categorizes its customers into one of three groups based on their banking habits. A random sample of 30 customers from each group was selected, and the number of times each customer visited the bank during the past year was recorded. The following table shows the summary statistics.
The bank manager will investigate whether there is a significant difference in mean numbers of bank visits for the groups. Multiple two-sample t-tests will be conducted, each at the significance level of α=0.05.
The significance level (α) of a single hypothesis test is the
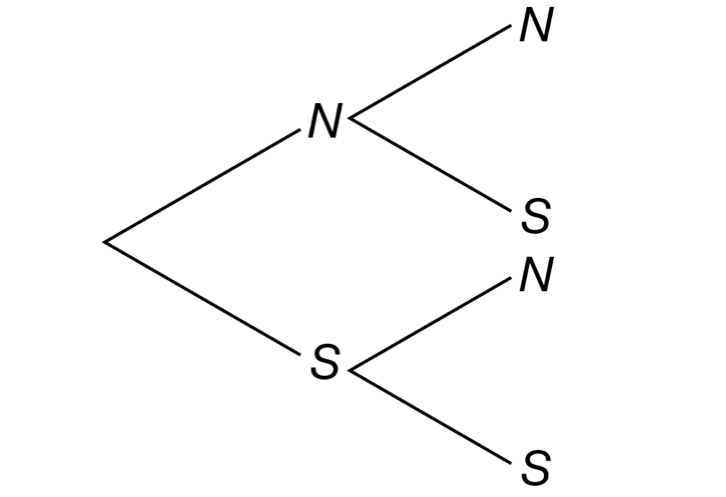
A t-test has two possible outcomes: reject or do not reject the null hypothesis. Suppose the null hypothesis is true. If the null hypothesis is rejected, the result is statistically significant, which would be a Type I error; if the null hypothesis is not rejected, the result is not statistically significant, which would not be a Type I error. Let S represent a statistically significant result, and let N represent a result that is not statistically significant.
The bank manager knows that the investigation will involve conducting multiple two-sample t-tests. The manager begins the investigation by considering two different t-tests as independent, successive trials. The possible outcomes of the trials, N or S, are shown in the following tree diagram.
The manager wants the family error rate to be close to 0.05. Suggest a single significance level α that could be used for all of the individual t-tests that will bring the family error rate close to 0.05. Show work to support your suggested level.


Trending nowThis is a popular solution!
Step by stepSolved in 8 steps with 4 images

- Before the furniture store began its ad campaign, it averaged 123 customers per day. The manager is investigating if the average is larger since the ad came out. The data for the 11 randomly selected days since the ad campaign began is shown below: 110, 154, 108, 112, 151, 146, 144, 130, 138, 129, 142 Assuming that the distribution is normal, what can be concluded at the a = 0.05 level of significance? a. For this study, we should use Select an answer b. The null and alternative hypotheses would be: Ho: vSelect an answer H1: ?V Select an answer V c. The test statistic ? (please show your answer to 3 decimal places.) d. The p-value = e. The p-value is ?V a f. Based on this, we should Select an answer g. Thus, the final conclusion is that ... (Please show your answer to 4 decimal places.) the null hypothesis. O The data suggest the populaton mean is significantly more than 123 at a = 0.05, so there is sufficient evidence to conclude that the population mean number of customers since the…arrow_forwardThe gas mileage for a 2020 Toyota Prius hybrid vehicle is skewed to the left, with μ = 55 miles per gallon and o = 8 miles per gallon. Suppose a random sample of n = 16 will be selected, the gas mileage will be recorded for each Toyota Prius, and the sample mean will be computed. Based on the information provided, which option applies to the distribution of possible sample mean values? The distribution of all possible sample mean values is normal because the population distribution of responses is normal. The distribution of all possible sample mean values is unknown because the sample size is not large enough and the population distribution of responses is not normal. The distribution of all possible sample mean values is approximately normal because the sample size n is large enough (at least 10 successes and at least 10 failures). The distribution of all possible sample mean values is approximately normal because the sample size n is large enough (larger than 25).arrow_forwardA researcher believes that children who attend elementary school in a rural setting have lower obesity rates then children who attend elementary school in an urban setting. The researcher collects a random sample from each population and records the proportion of children in each sample who are clinically obese. The data is summarized in the table below. Assume that all conditions for proceeding with a two-sample test have been met. Find the z-statistic (rounded to the nearest hundredth) and p-value (rounded to the nearest thousandth) for this hypothesis test. Using a 5% significance level, state the correct conclusion regarding the null hypothesis H0: prural = purban. a) z = -1.95, p = 0.026. There is sufficient evidence to reject the null hypothesis. b) z = -1.85, p = 0.032. There is sufficient evidence to accept the null hypothesis. c) z = -1.95, p = 0.026. There is not sufficient evidence to reject the null hypothesis. d) z =1.95, p = 0.026. There is sufficient evidence to…arrow_forward
- A special diet was given to a species of birds and the gain in weight (in grams) over a 5-week period was measured. The following are the summary statistics for a random sample of 30 birds: 5-number summary: 55, 90, 105, 120, 155.What is the most likely shape of the distribution?arrow_forwardFour brands of lightbulbs are being considered for use in the final assembly area of the Ford F-150 truck plant in Dearborn, Michigan. The director of purchasing asked for samples of 100 from each manufacturer. The numbers of acceptable and unacceptable bulbs from each manufacturer are shown below. At the .05 significance level, is there a difference in the quality of the bulbs? (Round your answers to 3 decimal places.) H0: There is no relationship between quality and manufacturer. H1: There is a relationship. 1. Reject H0 if X2 >____ 2. X2 = ____ (Reject or Do Not Reject) H0. Ther (is a/is no) relationship between quality and manufacturer.arrow_forwardListed below are the lead concentrations (in ug/g) measured in different Ayurveda medicines. Ayurveda is a traditional medical system commonly used in India. The lead concentrations listed here are from medicines manufactured in the United States. Assume that a simple random sample has been selected. Use a 0.01 significance level to test the claim that the mean lead concentration for all such medicines is less than 14.0 µg /g. 2.96 6.45 5.99 5.51 20.53 7.45 11.97 20.46 11.52 17.54 D Identify the null and alternative hypotheses. Ho: H1: (Type integers or decimals. Do not round.) Identify the test statistic. (Round to two decimal places as needed.) Identify the P-value. (Round to three decimal places as needed.) State the conclusion about the null hypothesis, as well as the final conclusion that addresses the original claim. V the null hypothesis. There sufficient evidence at the 0.01 significance level to V the claim that the mean lead concentration for all Ayurveda medicines…arrow_forward
- A large department store examined a sample of the 21 credit card sales and recorded the amounts charged for each of three types of credit cards: MasterCard, Visa, and Discover. Six MasterCard sales, seven Visa, and eight Discover sales were recorded. The store used an ANOVA to test if the mean sales for each credit card were equal. What are the degrees of freedom for the F statistic?arrow_forwardAcne is a common skin disease that affects most adolescents and can continue into adulthood. A study compared the effectiveness of three acne treatments and a placebo, all in gel form, applied twice daily for 12 weeks. The study's 517 teenage volunteers were randomly assigned to one of the four treatments. Success was assessed as clear or almost clear skin at the end of the 12 week period. The results of the study can be seen in the table below. Using the appropriate statistical test, determine if there is significant evidence that the four treatments perform differently. If so, how do they compare.arrow_forwardListed below are the lead concentrations (in µg/g) measured in different Ayurveda medicines. Ayurveda is a traditional medical system commonly used in India. The lead concentrations listed here are from medicines manufactured in the United States. Assume that a simple random sample has been selected. Use a 0.05 significance level to test the claim that the mean lead concentration for all such medicines is less than 14.0 µg/g. 5.98 5.50 20.54 3.03 6.46 Identify the null and alternative hypotheses. Ho: H 14 H₁: μ 14 (Type integers or decimals. Do not round.) Identify the test statistic. = (Round to two decimal places as needed.) 7.45 12.01 20.47 11.48 17.53 D S Vi I. (1,0) Morearrow_forward
- Suppose IQ scores were obtained for 20 randomly selected sets of couples. The 20 pairs of measurements yield x= 100.1, y = 98.3, r=0.961, P-value = 0.000, and y = - 18.02 + 1.16x, where x represents the IQ score of the wife. Find the best predicted value of y given that the wife has an IQ of 100? Use a significance level of 0.05. Click the icon to view the critical values of the Pearson correlation coefficient r. The best predicted value of y is (Round to two decimal places as needed.)arrow_forwardListed below are the lead concentrations (in µg/g) measured in different Ayurveda medicines. Ayurveda is a traditional medical system commonly used in India. The lead concentrations listed here are from medicines manufactured in the United States. Assume that a simple random sample has been selected. Use a 0.01 significance level to test the claim that the mean lead concentration for all such medicines is less than 14.0 μg/g. 2.95 6.46 6.00 5.46 20.49 7.51 12.02 20.45 11.50 17.54 Identify the null and alternative hypotheses. Ho H₁: (Type integers or decimals. Do not round.)arrow_forward
 MATLAB: An Introduction with ApplicationsStatisticsISBN:9781119256830Author:Amos GilatPublisher:John Wiley & Sons Inc
 Probability and Statistics for Engineering and th...StatisticsISBN:9781305251809Author:Jay L. DevorePublisher:Cengage Learning
 Statistics for The Behavioral Sciences (MindTap C...StatisticsISBN:9781305504912Author:Frederick J Gravetter, Larry B. WallnauPublisher:Cengage Learning
 Elementary Statistics: Picturing the World (7th E...StatisticsISBN:9780134683416Author:Ron Larson, Betsy FarberPublisher:PEARSON
 The Basic Practice of StatisticsStatisticsISBN:9781319042578Author:David S. Moore, William I. Notz, Michael A. FlignerPublisher:W. H. Freeman
 Introduction to the Practice of StatisticsStatisticsISBN:9781319013387Author:David S. Moore, George P. McCabe, Bruce A. CraigPublisher:W. H. Freeman


