MATLAB: An Introduction with Applications
6th Edition
ISBN: 9781119256830
Author: Amos Gilat
Publisher: John Wiley & Sons Inc
expand_more
expand_more
format_list_bulleted
Topic Video
Question
My question:
Dependent-samples t-test:
(a) develop a research question that can be addressed with dependent-samples t-test,
(b) state the null and alternative hypotheses (in words),
(c) state the alpha level,
(d) run the analysis, and
(e) provide interpretation of results (including checks for assumptions and effect size) following APA format

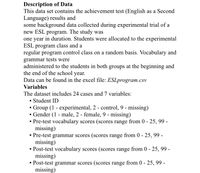
Transcribed Image Text:Description of Data
This data set contains the achievement test (English as a Second
Language) results and
some background data collected during experimental trial of a
new ESL program. The study was
one year in duration. Students were allocated to the experimental
ESL program class and a
regular program control class on a random basis. Vocabulary and
grammar tests were
administered to the students in both groups at the beginning and
the end of the school year.
Data can be found in the excel file: ESLprogram.csv
Variables
The dataset includes 24 cases and 7 variables:
• Student ID
- Group (1 - experimental, 2 - control, 9 - missing)
· Gender (1 - male, 2 - female, 9 - missing)
• Pre-test vocabulary scores (scores range from 0 - 25, 99 -
missing)
• Pre-test grammar scores (scores range from 0 - 25, 99 -
missing)
· Post-test vocabulary scores (scores range from 0 - 25, 99 -
missing)
· Post-test grammar scores (scores range from 0 - 25, 99 -
missing)

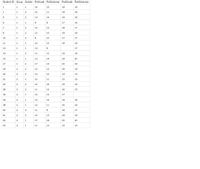
Transcribed Image Text:Student ID
Group
Gender PreVocab PreGrammar PostVocab PostGrammar
1
1
1
14
15
18
18
1
1
2
12
11
19
19
5
1
2
13
14
19
18
6
1
1
9
17
16
1
2
10
13
18
17
1
2
12
15
19
18
10
1
2
10
17
17
11
1
1
10
12
18
19
13
1
13
17
14
11
12
19
19
15
1
13
14
18
20
17
1
2
17
14
20
18
18
2
2
12
13
18
19
20
2
2
12
10
14
13
21
2
1
10
11
15
15
22
2
2
14
16
19
19
28
2
11
12
16
15
33
2
12
13
17
34
2
1
13
14
19
18
38
2
1
12
11
16
16
40
2
11
16
17
41
2
14
13
18
19
42
2
1
17
18
20
20
43
1
11
13
15
14
2.
2.
2.
Expert Solution
This question has been solved!
Explore an expertly crafted, step-by-step solution for a thorough understanding of key concepts.
Step by stepSolved in 2 steps

Knowledge Booster
Learn more about
Need a deep-dive on the concept behind this application? Look no further. Learn more about this topic, statistics and related others by exploring similar questions and additional content below.Similar questions
- You are a research assistant at a zoo. The question of your study is "Has the proportion of baby zebras born in zoos has changed from 10%?". Your supervisor asks that you run a hypothesis test using a significance level of 0.05. From the study, you obtain a z-score of 0.788. What type of z test is appropriate? What is the ? Right, one-tailed test. = +1.645 Right, one-tailed test. = -1.645 Left, one-tailed test. = +1.645 Left, one-tailed test. = -1.645 Two-tailed test. = +1.645 and -1.645arrow_forwardCan you show me the research hypotheses, null and alternative using the correct symbols for the following dataarrow_forwardhow do you answer question 25.30?arrow_forward
- Q2) Independent-Samples t-Test (Round calculated results to the hundredth (2nd place to the right of the decimal)) In a research project, researchers collected demographic and health data from a sample of elderly residents in the community. To examine any possible gender differences in their sample, they want to see if the females and the males differ significantly on the education level (number of years of formal schooling). The researchers are not predicting any direction in the possible gender differences so the hypotheses should be non-directional. They would like to run a two-tailed test with α = .10. Male Subject ID Education Female Subject ID Education 1 14 13 14 2 15 14 15 3 17 15 18 4 13 16 18 5 15 17 16 6 15 18 17 7 13 19 16 8 15 20 16 9 15 21 17 10 16 22 15 11 17…arrow_forward(a) What is a sample, i.e. test, statistic? (b) Why do we compare a test statistic to the critical value(s) in a hypothesis test?arrow_forwardWhat test should you use to analyze these results, and why? Will you use a one-tailed or a two-tailed test? Also, what is the result of your analysis?arrow_forward
- Please help with 1-8! I've seen a bunch of different answers and would love work shown so I can understand. Thank you! 1. are the samples dependent or independent? 2. State null/alternative hypotheses 3. what is the test statistic? 4. What is the p-value? 5. What are the critical values? 6. Does the test statistic lie in the rejection region? 7. interpret the results 8: does the result change for a different value of alpha? Explainarrow_forwardA researcher notes that there seems to be a difference in the prevalence of high blood pressure among college-educated individuals who consume low amounts of processed foods and the prevalence of individuals who only have a high school education and consume high amounts of processed foods. Use the appropriate hypothesis to test for the independence of the two independent variables presented here at the 5% significance level to ensure confounding has not influenced the study’s results. Then, interpret your response. Diet Low in Processed Foods Normal BP High BP Total College Education 124 55 179 High School Education 69 152 221 Total 193 207 400 Diet High in Processed Foods Normal BP High BP Total College Education 64 85 149 High School Education 98 153 251 Total 162 238 400 The chi square value of 37.724 is higher than the chi square value of 3.84; therefore, we can accept H0 at…arrow_forwardYou are conducting a study to see if the accuracy rate for fingerprint identification is significantly different from 0.23. You use a significance level of α=0.01 H0:p=0.23 H1:p≠0.23You obtain a sample of size n=228n=228 in which there are 70 successes.What is the test statistic for this sample? (Report answer accurate to three decimal places.)test statistic = What is the p-value for this sample? (Report answer accurate to four decimal places.)p-value = The p-value is... less than (or equal to) αα greater than αα This test statistic leads to a decision to... reject the null accept the null fail to reject the null As such, the final conclusion is that... The sample data support the claim that the accuracy rate for fingerprint identification is different from 0.23. There is not sufficient sample evidence to support the claim that the accuracy rate for fingerprint identification is different from 0.23.arrow_forward
- On a trial basis, State College admitted 300 students from the lowest third of their high school graduation class. They were randomly divided into 3 groups. Group A received extensive training in study habits Group B received motivational lectures; and Group C received no special treatment. At the end of the year, the average grades of the groups were compared. Identify the following: * What is the Independent variable? * What is the Dependent variable? * Who is in the Experimental Group? * Who is in the Control Group? * What are at least 2 potential extraneous variables?arrow_forwardName of the procedure/formula (e.g., ANOVA, Chi-Square, Hypothesis Test using z formula, Regression Analysis, etc.).arrow_forward
arrow_back_ios
arrow_forward_ios
Recommended textbooks for you
 MATLAB: An Introduction with ApplicationsStatisticsISBN:9781119256830Author:Amos GilatPublisher:John Wiley & Sons Inc
 Probability and Statistics for Engineering and th...StatisticsISBN:9781305251809Author:Jay L. DevorePublisher:Cengage Learning
 Statistics for The Behavioral Sciences (MindTap C...StatisticsISBN:9781305504912Author:Frederick J Gravetter, Larry B. WallnauPublisher:Cengage Learning
 Elementary Statistics: Picturing the World (7th E...StatisticsISBN:9780134683416Author:Ron Larson, Betsy FarberPublisher:PEARSON
 The Basic Practice of StatisticsStatisticsISBN:9781319042578Author:David S. Moore, William I. Notz, Michael A. FlignerPublisher:W. H. Freeman
 Introduction to the Practice of StatisticsStatisticsISBN:9781319013387Author:David S. Moore, George P. McCabe, Bruce A. CraigPublisher:W. H. Freeman

MATLAB: An Introduction with Applications
Statistics
ISBN:9781119256830
Author:Amos Gilat
Publisher:John Wiley & Sons Inc

Probability and Statistics for Engineering and th...
Statistics
ISBN:9781305251809
Author:Jay L. Devore
Publisher:Cengage Learning

Statistics for The Behavioral Sciences (MindTap C...
Statistics
ISBN:9781305504912
Author:Frederick J Gravetter, Larry B. Wallnau
Publisher:Cengage Learning

Elementary Statistics: Picturing the World (7th E...
Statistics
ISBN:9780134683416
Author:Ron Larson, Betsy Farber
Publisher:PEARSON

The Basic Practice of Statistics
Statistics
ISBN:9781319042578
Author:David S. Moore, William I. Notz, Michael A. Fligner
Publisher:W. H. Freeman

Introduction to the Practice of Statistics
Statistics
ISBN:9781319013387
Author:David S. Moore, George P. McCabe, Bruce A. Craig
Publisher:W. H. Freeman