MATLAB: An Introduction with Applications
6th Edition
ISBN: 9781119256830
Author: Amos Gilat
Publisher: John Wiley & Sons Inc
expand_more
expand_more
format_list_bulleted
Concept explainers
Topic Video
Question

Transcribed Image Text:**Comparing Daily Travel Expenses: A Statistical Exercise**
Ms. Lisa Mannin is the budget director for Nexus Media Inc. She would like to compare the daily travel expenses of the sales staff and the audit staff. She collected the following sample information:
- **Sales ($):** 129, 133, 147, 159, 138, 143
- **Audit ($):** 124, 102, 126, 140, 146, 105, 139
**Hypothesis Testing at the 0.10 Significance Level**
*Objective:* Can she conclude that the mean daily expenses are greater for the sales staff than the audit staff?
1. **State the Decision Rule (Round 3 Decimal Places):**
- Reject \( H_0 \) if \( t > \) _______
2. **Compute the Pooled Estimate of the Population Variance (Round 2 Decimal Places):**
- **Pooled Variance:** _______
3. **Compute the Test Statistic (Round 3 Decimal Places):**
- **Value of the Test Statistic:** _______
This exercise involves performing a hypothesis test to determine if there is a statistically significant difference in the mean travel expenses between two groups, specifically focusing on comparing mean values using a t-test.
Expert Solution
arrow_forward
Step 1
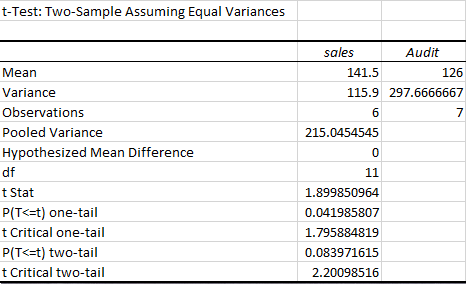
Excel Procedure:
Enter the data for ‘sales’ and ‘Audit’ in Excel sheet>Data>Data Analysis>Select ‘t-Test: Two-Sample Assuming Equal Variances’ and click on ‘OK’>Select the column of ‘sales’ under ‘Variable 1 Range’>Select the column of ‘Audit’ under ‘Variable 2 Range’>Enter 0 under ‘Hypothesized Mean Difference’>Click on ‘OK’.
Excel Output:

From the output, the one sided critical value is 1.796.
Decision Rule:
Reject H0 if t>1.796
Step by stepSolved in 2 steps with 1 images

Knowledge Booster
Learn more about
Need a deep-dive on the concept behind this application? Look no further. Learn more about this topic, statistics and related others by exploring similar questions and additional content below.Similar questions
- Mr. Raual's Tree Cutting Company charges a lat fee of $35 for a service call, plurs $30 per hour to out trees. Mrs. Regina's Tree Cutting Company Uses the grapph belo w to determine the total cost of cutting diown t ees. Mrs. Regina's Tree CCutting Comp any 380 340 300 260 220 180 3 140 100 60 20 6. Time Chours) 20 Mr. Raual's Tree Cutting Company charges $25 more than Mrs. Regina's Tree Cutting Company. Mrs. Regina's Tree Cutting C ompany charges $25 more than Mr. Raus Tree Cutting Company. Mr. Raual's Tree Cutting Companny charges $10 more than Mrs. Reginas Tree Cutting Company. Mrs. Regina's Tree Cuteing Company charges s 10 more than Mr. Raurs Tree Cutting Company. Total Cost ($)arrow_forward2.) a day and a ruck. MIchael rented a muck for A rental company charges S65 so cents a mile for rentr 30ays, and nis bills came to $273. How many miles ald ne crìve?arrow_forwardpogle.com tzq-fkbk-qmg?authuser=D0 s presenting r frame 567 4. Write how 5 bloopers = 4 gloopers 12 gloopers = 21 droopers you figured it out. How many droopers equal 20 bloopers? 567 67arrow_forward
- Quinn drives from her house to paula's, then to Renato's and then back to her house. What is her total distance driven, rounded to the nearest mile?arrow_forward4. Ruth has a ribbon that is 19 inches long. For a project she needs 6 sections of ribbon that are each 1 inches long. How long will Ruth's ribbon be after she cuts off those 6 sections? A. 10 inches B. 11글 inches C.12를 inches D. 13 inches * Previousarrow_forward11arrow_forward
- 3 The admissIon fee at an amurement park is #3.25 for children į # l6.80 tor adu HC on a sertain day, 338 Deodle enterad the Dark, and the amas t admissim fles callected totaled $1723. HOW many children how many adultr were admitted? #of children #of adu Hsarrow_forwardb. 10 с. C. 2 d. 4 7. Stella earned $72 working 9 h. How much will she earn in 23 h? a. $207 b. $343 $86 d. $184 C. D. ह 1 -htarrow_forward3Jeseph receiled a Toan at Sicmple Tuteret Ifor 10 mouths. If he woces Ichaerged luterest caf 8 355. at Ite rend of the period, oheet Loes te principul amout cof tte loau?arrow_forward
arrow_back_ios
arrow_forward_ios
Recommended textbooks for you
 MATLAB: An Introduction with ApplicationsStatisticsISBN:9781119256830Author:Amos GilatPublisher:John Wiley & Sons Inc
 Probability and Statistics for Engineering and th...StatisticsISBN:9781305251809Author:Jay L. DevorePublisher:Cengage Learning
 Statistics for The Behavioral Sciences (MindTap C...StatisticsISBN:9781305504912Author:Frederick J Gravetter, Larry B. WallnauPublisher:Cengage Learning
 Elementary Statistics: Picturing the World (7th E...StatisticsISBN:9780134683416Author:Ron Larson, Betsy FarberPublisher:PEARSON
 The Basic Practice of StatisticsStatisticsISBN:9781319042578Author:David S. Moore, William I. Notz, Michael A. FlignerPublisher:W. H. Freeman
 Introduction to the Practice of StatisticsStatisticsISBN:9781319013387Author:David S. Moore, George P. McCabe, Bruce A. CraigPublisher:W. H. Freeman

MATLAB: An Introduction with Applications
Statistics
ISBN:9781119256830
Author:Amos Gilat
Publisher:John Wiley & Sons Inc

Probability and Statistics for Engineering and th...
Statistics
ISBN:9781305251809
Author:Jay L. Devore
Publisher:Cengage Learning

Statistics for The Behavioral Sciences (MindTap C...
Statistics
ISBN:9781305504912
Author:Frederick J Gravetter, Larry B. Wallnau
Publisher:Cengage Learning

Elementary Statistics: Picturing the World (7th E...
Statistics
ISBN:9780134683416
Author:Ron Larson, Betsy Farber
Publisher:PEARSON

The Basic Practice of Statistics
Statistics
ISBN:9781319042578
Author:David S. Moore, William I. Notz, Michael A. Fligner
Publisher:W. H. Freeman

Introduction to the Practice of Statistics
Statistics
ISBN:9781319013387
Author:David S. Moore, George P. McCabe, Bruce A. Craig
Publisher:W. H. Freeman