
MATLAB: An Introduction with Applications
6th Edition
ISBN: 9781119256830
Author: Amos Gilat
Publisher: John Wiley & Sons Inc
expand_more
expand_more
format_list_bulleted
Related questions
Topic Video
Question
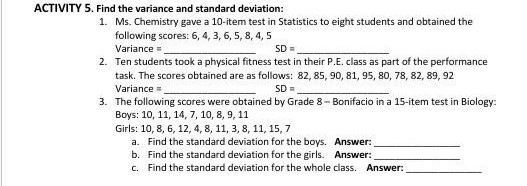

Transcribed Image Text:ACTIVITY 5. Find the variance and standard deviation:
1. Ms. Chemistry gave a 10-item test in Statistics to eight students and obtained the
following scores: 6, 4, 3, 6, 5, 8, 4, 5
Variance=
SD=
2. Ten students took a physical fitness test in their P.E. class as part of the performance
task. The scores obtained are as follows: 82, 85, 90, 81, 95, 80, 78, 82, 89, 92
Variance =
3. The following scores were obtained by Grade 8- Bonifacio in a 15-item test in Biology:
Boys: 10, 11, 14, 7, 10, 8, 9, 11
SD =
Girls: 10, 8, 6, 12, 4, 8, 11, 3, 8, 11, 15, 7
a. Find the standard deviation for the boys. Answer:
b. Find the standard deviation for the girls. Answer:
c. Find the standard deviation for the whole class. Answer:
Expert Solution
This question has been solved!
Explore an expertly crafted, step-by-step solution for a thorough understanding of key concepts.

Step by stepSolved in 2 steps with 1 images

Knowledge Booster


Learn more about
Need a deep-dive on the concept behind this application? Look no further. Learn more about this topic, statistics and related others by exploring similar questions and additional content below.Similar questions
- What is the pooled variance for the following two samples? Sample1: n = 8 and SS = 168: sample 2: n = 6 and SS = 120.arrow_forwardSay we were testing the effects of taking calcium on bone density levels and obtained a positive and significant value for our independent t test result. What would you write (using APA format) when performing a percentage of variance explained test on the data and received a value of r2=.38.arrow_forwardOne sample has n=7 and SS=35 and a second sample has n =17 and SS =45. What is the pooled variance for these two samples?arrow_forward
- In an effort to counteract student cheating, the professor of a large class created four versions of a midterm exam, distributing the four versions among the 344 students in the class, so that each version was given to 86 students. After the exam, the professor computed the following information about the scores (the exam was worth 200 points): Group Sample Sample Sample size mean variance Version A Version B Version C Version D 86 150.3 420.3 86 155.7 352.0 86 148.5 479.1 86 158.8 369.9 Send data to calculator Send data to Excel The professor is willing to assume that the populations of scores from which the above samples were drawn are approximately normally distributed and that each has the same mean and the same variance. Answer the following, carrying your intermediate computations to at least three decimal places and rounding your responses to at least one decimal place. (a) Give an estimate of this common population variance based on the variance of the sample means given. (b)…arrow_forwardIf you have samples of n₁ = 22 and n₂ = 19, in performing the pooled-variance t test, how many degrees of freedom do you have? You have degrees of freedom.arrow_forwardKindly answer part i. & ii. only.arrow_forward
- A sample of n = 10 has s = 3. What are the correct values for S.S. and s2? SS=44;sampleS.D.=3 SS = 81; sample variance = 9 SS = 30; sample variance = 4 SS=27;sampleS.D.=2arrow_forwardWe are interested in determining whether or not the variances of the sales at two music stores (A and B) are equal. A sample of 16 days of sales at store A has a sample variance of 20 while a sample of 26 days of sales from store B has a sample variance of 30. The test statistic isarrow_forward. If one sample has n = 5 scores with SS = 40 and a second sample has n = 5 scores with SS = 20, then what is the pooled variancearrow_forward
- What are the values for SS and variance for the following sample of n = 3 scores? Sample: 8, 5, 2arrow_forward. What are the values of SS and variance s? for the following sample of n=3 scores? Sample: 1, 4, 7arrow_forwardIf you have samples of n1=19 and n2=24, in performing the pooled-variance t test, how many degrees of freedom do you have?arrow_forward
arrow_back_ios
SEE MORE QUESTIONS
arrow_forward_ios
Recommended textbooks for you
- MATLAB: An Introduction with ApplicationsStatisticsISBN:9781119256830Author:Amos GilatPublisher:John Wiley & Sons Inc
 Probability and Statistics for Engineering and th...StatisticsISBN:9781305251809Author:Jay L. DevorePublisher:Cengage Learning
 Statistics for The Behavioral Sciences (MindTap C...StatisticsISBN:9781305504912Author:Frederick J Gravetter, Larry B. WallnauPublisher:Cengage Learning
  Elementary Statistics: Picturing the World (7th E...StatisticsISBN:9780134683416Author:Ron Larson, Betsy FarberPublisher:PEARSON
 The Basic Practice of StatisticsStatisticsISBN:9781319042578Author:David S. Moore, William I. Notz, Michael A. FlignerPublisher:W. H. Freeman
 Introduction to the Practice of StatisticsStatisticsISBN:9781319013387Author:David S. Moore, George P. McCabe, Bruce A. CraigPublisher:W. H. Freeman
MATLAB: An Introduction with Applications
Statistics
ISBN:9781119256830
Author:Amos Gilat
Publisher:John Wiley & Sons Inc
Probability and Statistics for Engineering and th...
Statistics
ISBN:9781305251809
Author:Jay L. Devore
Publisher:Cengage Learning
Statistics for The Behavioral Sciences (MindTap C...
Statistics
ISBN:9781305504912
Author:Frederick J Gravetter, Larry B. Wallnau
Publisher:Cengage Learning
Elementary Statistics: Picturing the World (7th E...
Statistics
ISBN:9780134683416
Author:Ron Larson, Betsy Farber
Publisher:PEARSON
The Basic Practice of Statistics
Statistics
ISBN:9781319042578
Author:David S. Moore, William I. Notz, Michael A. Fligner
Publisher:W. H. Freeman
Introduction to the Practice of Statistics
Statistics
ISBN:9781319013387
Author:David S. Moore, George P. McCabe, Bruce A. Craig
Publisher:W. H. Freeman