MATLAB: An Introduction with Applications
6th Edition
ISBN: 9781119256830
Author: Amos Gilat
Publisher: John Wiley & Sons Inc
expand_more
expand_more
format_list_bulleted
Concept explainers
Question
thumb_up100%
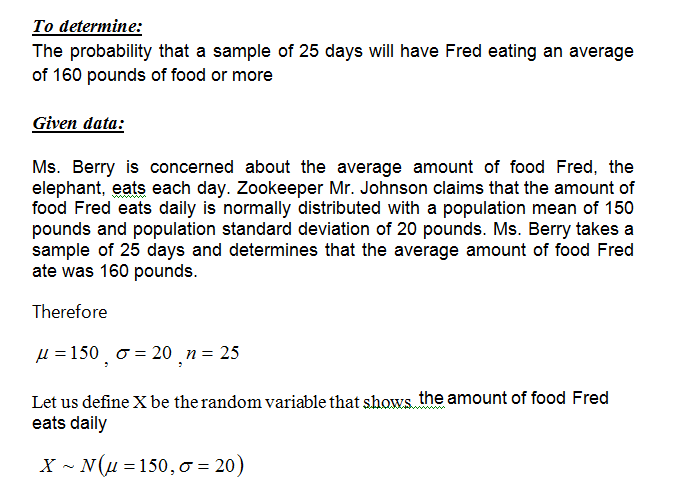
Ms. Berry is concerned about the average amount of food Fred, the elephant, eats each day. Zookeeper Mr. Johnson claims that the amount of food Fred eats daily is
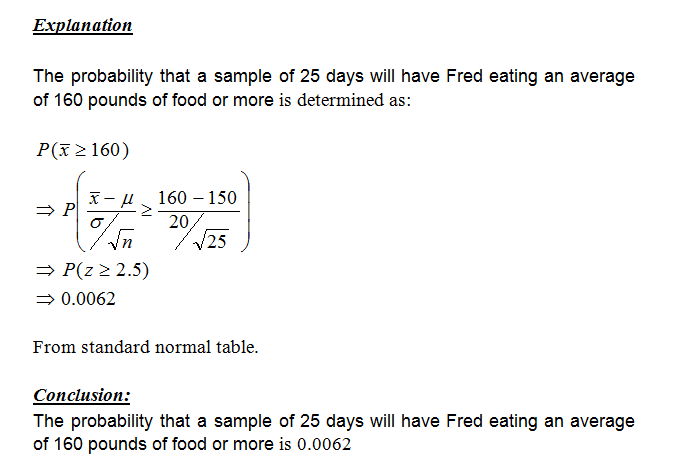
a. Assuming Mr. Johnson is correct, what is the
b. Given your answer in part a should Ms. Berry be concerned that Fred is overeating?
Expert Solution
arrow_forward
Step 1

arrow_forward
Step 2

Step by stepSolved in 3 steps with 2 images

Knowledge Booster
Learn more about
Need a deep-dive on the concept behind this application? Look no further. Learn more about this topic, statistics and related others by exploring similar questions and additional content below.Similar questions
- A large tank of fish from a hatchery is being delivered to a lake. The hatchery claims that the mean length of fish in the tank is 15 inches, and the standard deviation is 4 inches. A random sample of 26 fish is taken from the tank. Let x be the mean sample length of these fish. What is the probability that x is within 0.5 inch of the claimed population mean?arrow_forwardAn engineer is going to redesign an ejection seat for the airplane. The seat was designed for pilots weighing between 150 and 191 pounds. The new population of pilots has normally distributed weights with a mean of 158 pounds and a standard deviation or 31.1 pounds. a. If a pilot is randomly selected, find the probability that his weight is between 150 lb and 191 lb. b. If 38 pilots are randomly selected, find the probability that their mean weight is between 150 lb and 191 lb. what is the approximate probability? c. When redesigning the ejection seat, which probability is more relevant? part b because the seat performance for a single pilot is more important part b because the seat performance for a sample of pilots is more important Part a because the seat performance for a single pilot is more important part a because the seat performance for a sample of pilots is more important. please show solving steps and if possible tell me how to also get these answers through excel…arrow_forwardIn a recent year, 11th grade New York public school students taking an English test produced test scores that were normally distributed with a mean of 84 and a standard deviation of 7.2. Let x be a random variable that represents a test score. What is the lowest score that would still place a student in the top 30% of the scores? A. 85.82 B. 87.78 C. 82.52 D. 79.47arrow_forward
- I need help with this question.arrow_forwardAn engineer is going to redesign an ejection seat for an airplane. The seat was designed for pilots weighing between 120 lb and 181 lb. The new population of pilots has normally distributed weights with a mean of 129 lb and a standard deviation of 27.3 lb. If a pilot is randomly selected, find the probability that his weight is between 120 lb and 181 lb. The probability is approximately nothingarrow_forwardCynthia is president of an international chemical distribution company, Cchem. Weekly gross sales for Cchem has a mean of $1 million and standard deviation of $0.2 million; the distribution of sales is highly right-skewed. One week’s sales are independent of the sales in any other week. Use this information to answer questions 5 to 6 below. What is the probability that sales for the week of October 5, 2009 will be more than $1.25 million? In order for Cynthia to receive a bonus, Cchem’s annual sales must exceed $53 million. What is the probability that Cynthia will receive a bonus for the fiscal year starting in 2010? Assume there are 52 weeks in a year.arrow_forward
- The Aluminum Association reports that the average American uses 56.8 pounds of aluminum in a year. A random sample of 49 households is monitored for one year to determine aluminum usage. If the population standard deviation of annual usage is 12.1 pounds, what is the probability that the sample mean will be each of the following? Appendix A Statistical Tables a. More than 58 poundsb. More than 56 poundsc. Between 55 and 57 poundsd. Less than 54 poundse. Less than 48 pounds(Round the values of z to 2 decimal places. Round your answers to 4 decimal places.)a. enter the probability that the sample mean will be more than 58 poundsb. enter the probability that the sample mean will be more than 56 poundsc. enter the probability that the sample mean will be between 55 and 57 poundsd. enter the probability that the sample mean will be less than 54 poundse. enter the probability that the sample mean will be less than 48 poundsarrow_forwardSome sources report that the weights of full-term newborn babies in a certain town have a mean of 9 pounds and a standard deviation of 1.2 pounds and are Normally distributed. a. What is the probability that one newborn baby will have the mean? weight within 1.2 pounds of the mean-that is, between 7.8 and 10.2 pounds, or within one standard deviation of b. What is the probability that the average of four babies' weights will be within 1.2 pounds of the mean; will be between 7.8 and 10.2 pounds? c. Explain the difference between (a) and (b). a. The probability is: (Round to four decimal places as needed.) b. The probability is. (Round to four decimal places as needed.) c. The distribution of means is taller and than the original distribution. Therefore, the distribution of means will have narrower more observations located closer to the center of the distribution.arrow_forwardBeef Consumption. According to Food Consumption, Prices, and Expenditures, published by the U.S. Department of Agriculture, the mean consumption of beef per person in 2011 was 57.5 lb. A sample of 40 people taken this year yielded the data, in pounds, on last year’s beef consumption given on the WeissStats site. Use the technology of your choice to do the following. a. Obtain a normal probability plot, a boxplot, a histogram, and a stem-and-leaf diagram of the data on beef consumptions. b. Decide, at the 5% significance level, whether last year’s mean beef consumption is less than the 2011 mean of 57.5 lb. Apply the onemean t-test. c. The sample data contain four potential outliers: 0, 0, 0, and 13. Remove those four observations, repeat the hypothesis test in part (b), and compare your result with that obtained in part (b). d. Assuming that the four potential outliers are not recording errors, comment on the advisability of removing them from the sample data before performing the…arrow_forward
- The weight of items produced by a machine is normally distributed with a mean of 8 ounces and a standard deviation of 2 ounces.Refer to Exhibit 6-5. What is the random variable in this experiment? a. 8 ounces b. Weight of items produced by a machine c. Normal distribution d. 2 ouncesarrow_forwardThe Aluminum Association reports that the average American uses 56.8 pounds of aluminum in a year. A random sample of 50 households is monitored for one year to determine aluminum usage. If the population standard deviation of annual usage is 12.3 pounds, what is the probability that the sample mean will be each of the following? Appendix A Statistical Tables d. Less than 55 poundse. Less than 49 poundsarrow_forwardSuppose that a plaque in an elevator contains the following statement: Maximum weight 3500 pounds or 18 people. What is the probability that this elevator will be overloaded given that the weight of men is normally distributed with a mean of 179.2 pounds and a standard deviation of 29.6 pounds? A. 0.3468 O B. 0.0144 O C. 0,6532 O D. 0.9856arrow_forward
arrow_back_ios
SEE MORE QUESTIONS
arrow_forward_ios
Recommended textbooks for you
 MATLAB: An Introduction with ApplicationsStatisticsISBN:9781119256830Author:Amos GilatPublisher:John Wiley & Sons Inc
 Probability and Statistics for Engineering and th...StatisticsISBN:9781305251809Author:Jay L. DevorePublisher:Cengage Learning
 Statistics for The Behavioral Sciences (MindTap C...StatisticsISBN:9781305504912Author:Frederick J Gravetter, Larry B. WallnauPublisher:Cengage Learning
 Elementary Statistics: Picturing the World (7th E...StatisticsISBN:9780134683416Author:Ron Larson, Betsy FarberPublisher:PEARSON
 The Basic Practice of StatisticsStatisticsISBN:9781319042578Author:David S. Moore, William I. Notz, Michael A. FlignerPublisher:W. H. Freeman
 Introduction to the Practice of StatisticsStatisticsISBN:9781319013387Author:David S. Moore, George P. McCabe, Bruce A. CraigPublisher:W. H. Freeman

MATLAB: An Introduction with Applications
Statistics
ISBN:9781119256830
Author:Amos Gilat
Publisher:John Wiley & Sons Inc

Probability and Statistics for Engineering and th...
Statistics
ISBN:9781305251809
Author:Jay L. Devore
Publisher:Cengage Learning

Statistics for The Behavioral Sciences (MindTap C...
Statistics
ISBN:9781305504912
Author:Frederick J Gravetter, Larry B. Wallnau
Publisher:Cengage Learning

Elementary Statistics: Picturing the World (7th E...
Statistics
ISBN:9780134683416
Author:Ron Larson, Betsy Farber
Publisher:PEARSON

The Basic Practice of Statistics
Statistics
ISBN:9781319042578
Author:David S. Moore, William I. Notz, Michael A. Fligner
Publisher:W. H. Freeman

Introduction to the Practice of Statistics
Statistics
ISBN:9781319013387
Author:David S. Moore, George P. McCabe, Bruce A. Craig
Publisher:W. H. Freeman