
MATLAB: An Introduction with Applications
6th Edition
ISBN: 9781119256830
Author: Amos Gilat
Publisher: John Wiley & Sons Inc
expand_more
expand_more
format_list_bulleted
Related questions
Concept explainers
Topic Video
Question
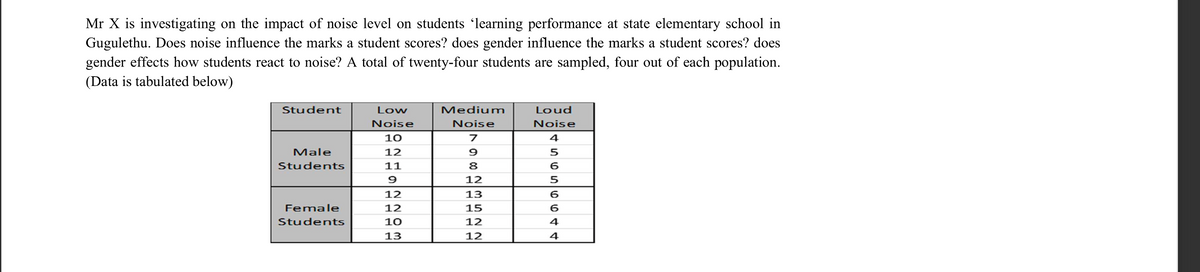

Transcribed Image Text:Mr X is investigating on the impact of noise level on students ʻlearning performance at state elementary school in
Gugulethu. Does noise influence the marks a student scores? does gender influence the marks a student scores? does
gender effects how students react to noise? A total of twenty-four students are sampled, four out of each population.
(Data is tabulated below)
Student
Low
Medium
Loud
Noise
Noise
Noise
10
4
Male
12
Students
11
8
6
12
12
13
6
Female
12
15
6.
Students
10
12
4
13
12
4

Transcribed Image Text:Given Σ-1 Σ-1 Σ-1 Vik
r5
.2
=D1
28235, complete the highlighted sections of the ANOVA table below in
your booklet.
ANOVA
F
Source of Variation
SS
df
MS
F
Factor A
200
2
48,73
Factor B
1
Interaction
2
3.97
Error
37
18
Total
23
Expert Solution
This question has been solved!
Explore an expertly crafted, step-by-step solution for a thorough understanding of key concepts.

Step by stepSolved in 7 steps

Knowledge Booster


Learn more about
Need a deep-dive on the concept behind this application? Look no further. Learn more about this topic, statistics and related others by exploring similar questions and additional content below.Similar questions
- 4. Which one of the following data sets has more than one mode? O A. (10, 20, 30, 30, 40, 50, 50) O B. (10, 20, 30, 40, 50, 70, 70) O C. (20, 20, 30, 30, 30, 40, 40) O D. (10, 20, 30, 40, 50, 60, 70)arrow_forwardThe following table shows a sample dataset of observation values of an independent variable, Age, and a dependent variable, number of toys Age 5 3 6 3 4 4 6 8 Toys 13 15 7 12 13 11 9 5 What is the value of Toys when Age is 7 (round your answer without decimal)arrow_forwardAsk a Question | bartleby Karnataka Board Class 11th Stat × Karnataka Board Class 11th Stat × + I selfstudys.com/books/karnataka/state-books/class-11th/statistics/statistics-part-1/328854 34. In a sample study regarding smoking habit in a town, the following data were obtained: Men population = 58% Smokers = 22% Men smokers = 18% 1 Tabulate the above data. Join Whatsapp For Exclusive Content Search 89/100 myhp Join Telegram For Exclusive Content 0 1 x 21:58 ENG IN 20-08-2024 PREarrow_forward
- I need help with 7, 8 and 9arrow_forwardA statistical program is recommended. You may need to use this table to answer this question. A study investigated the relationship between audit delay (Delay), the length of time from a company's fiscal year-end to the date of the auditor's report, and variables that describe the client and the auditor. Some of the independent variables that were included in this study follow. Industry Public Quality Finished 62 45 A sample of 40 companies provided the following data. 54 Delay Industry Public Quality 71 91 62 61 2 69 80 52 47 65 60 81 73 89 71 76 68 68 86 76 67 57 55 54 69 82 94 74 75 69 71 79 80 91 92 46 A dummy variable coded 1 if the firm was an industrial company or 0 if the firm was a bank, savings and loan, or insurance company. 72 A dummy variable coded 1 if the company was traded on an organized exchange or over the counter; otherwise coded 0. 85 A measure of overall quality of internal controls, as judged by the auditor, on a five-point scale ranging from "virtually none" (1)…arrow_forwardHow would you interpret these results? 1. The effect of gender caused different levels of Stroop tas performance at different ages. 2. The effect of age caused different levels of Stroop task performance in men than women. 3. The interaction between gender and age did not affect Stroop task performance. 4. a and b 5. None of the above.arrow_forward
- A survey was developed to estimate the average number of hours per week that adults spend exercising. Every third person entering a large fitness complex was surveyed, with a total of 2,500 people being surveyed. The data showed that the mean number of hours spent exercising was 3.2 hours per week. Which characteristic of the survey could create a bias in the results? The size of the sample The size of the sample The method of analyzing the data The method of analyzing the data The method of choosing the people who were surveyed The method of choosing the people who were surveyed The size of the populationarrow_forwardThe results of a random sample of students by type of school and their attitudes on safety steps taken by the school staff are shown in the table below. At the 5% significance level, can you conclude that attitudes about safety steps taken by the school staff are related to the type of school? School staff has School Type Taken all steps for student safety Taken some steps for student safety Public 40 51 Private 64 34arrow_forwardDoes the type of instruction in a college statistics class (either lecture or self-paced) influence students’ performance, as measured by the number of quizzes successfully completed during the semester? Twelve students were recruited for the study. Students received the lecture instruction or a self-paced instruction. The total number of quizzes completed during teach type of instruction appear below.arrow_forward
arrow_back_ios
arrow_forward_ios
Recommended textbooks for you
- MATLAB: An Introduction with ApplicationsStatisticsISBN:9781119256830Author:Amos GilatPublisher:John Wiley & Sons Inc
 Probability and Statistics for Engineering and th...StatisticsISBN:9781305251809Author:Jay L. DevorePublisher:Cengage Learning
 Statistics for The Behavioral Sciences (MindTap C...StatisticsISBN:9781305504912Author:Frederick J Gravetter, Larry B. WallnauPublisher:Cengage Learning
  Elementary Statistics: Picturing the World (7th E...StatisticsISBN:9780134683416Author:Ron Larson, Betsy FarberPublisher:PEARSON
 The Basic Practice of StatisticsStatisticsISBN:9781319042578Author:David S. Moore, William I. Notz, Michael A. FlignerPublisher:W. H. Freeman
 Introduction to the Practice of StatisticsStatisticsISBN:9781319013387Author:David S. Moore, George P. McCabe, Bruce A. CraigPublisher:W. H. Freeman
MATLAB: An Introduction with Applications
Statistics
ISBN:9781119256830
Author:Amos Gilat
Publisher:John Wiley & Sons Inc
Probability and Statistics for Engineering and th...
Statistics
ISBN:9781305251809
Author:Jay L. Devore
Publisher:Cengage Learning
Statistics for The Behavioral Sciences (MindTap C...
Statistics
ISBN:9781305504912
Author:Frederick J Gravetter, Larry B. Wallnau
Publisher:Cengage Learning
Elementary Statistics: Picturing the World (7th E...
Statistics
ISBN:9780134683416
Author:Ron Larson, Betsy Farber
Publisher:PEARSON
The Basic Practice of Statistics
Statistics
ISBN:9781319042578
Author:David S. Moore, William I. Notz, Michael A. Fligner
Publisher:W. H. Freeman
Introduction to the Practice of Statistics
Statistics
ISBN:9781319013387
Author:David S. Moore, George P. McCabe, Bruce A. Craig
Publisher:W. H. Freeman