
MATLAB: An Introduction with Applications
6th Edition
ISBN: 9781119256830
Author: Amos Gilat
Publisher: John Wiley & Sons Inc
expand_more
expand_more
format_list_bulleted
Related questions
Topic Video
Question
I need to know how to work this problem the relationship between gender and party preference for this group The A & B solution what does this mean This is from The Essentials of Statistics 4th Edition

Transcribed Image Text:mor
Double-check to make sure you are using the cor-
10.4 SOC
high or l
of handgu
leono rect values for each cell.
a. 20 25
45
c. 25
15
40
25
20
45
30
30
60
a. Is there a
cities with
45
45
90
55
45
100
higher han
b. 10 15 25
d. 20
45
65
tence or tw
test and the
b. The table is
20
30
50
15
20
35
30 m 45
75
35
65
100
rate is the i
cide rates ca
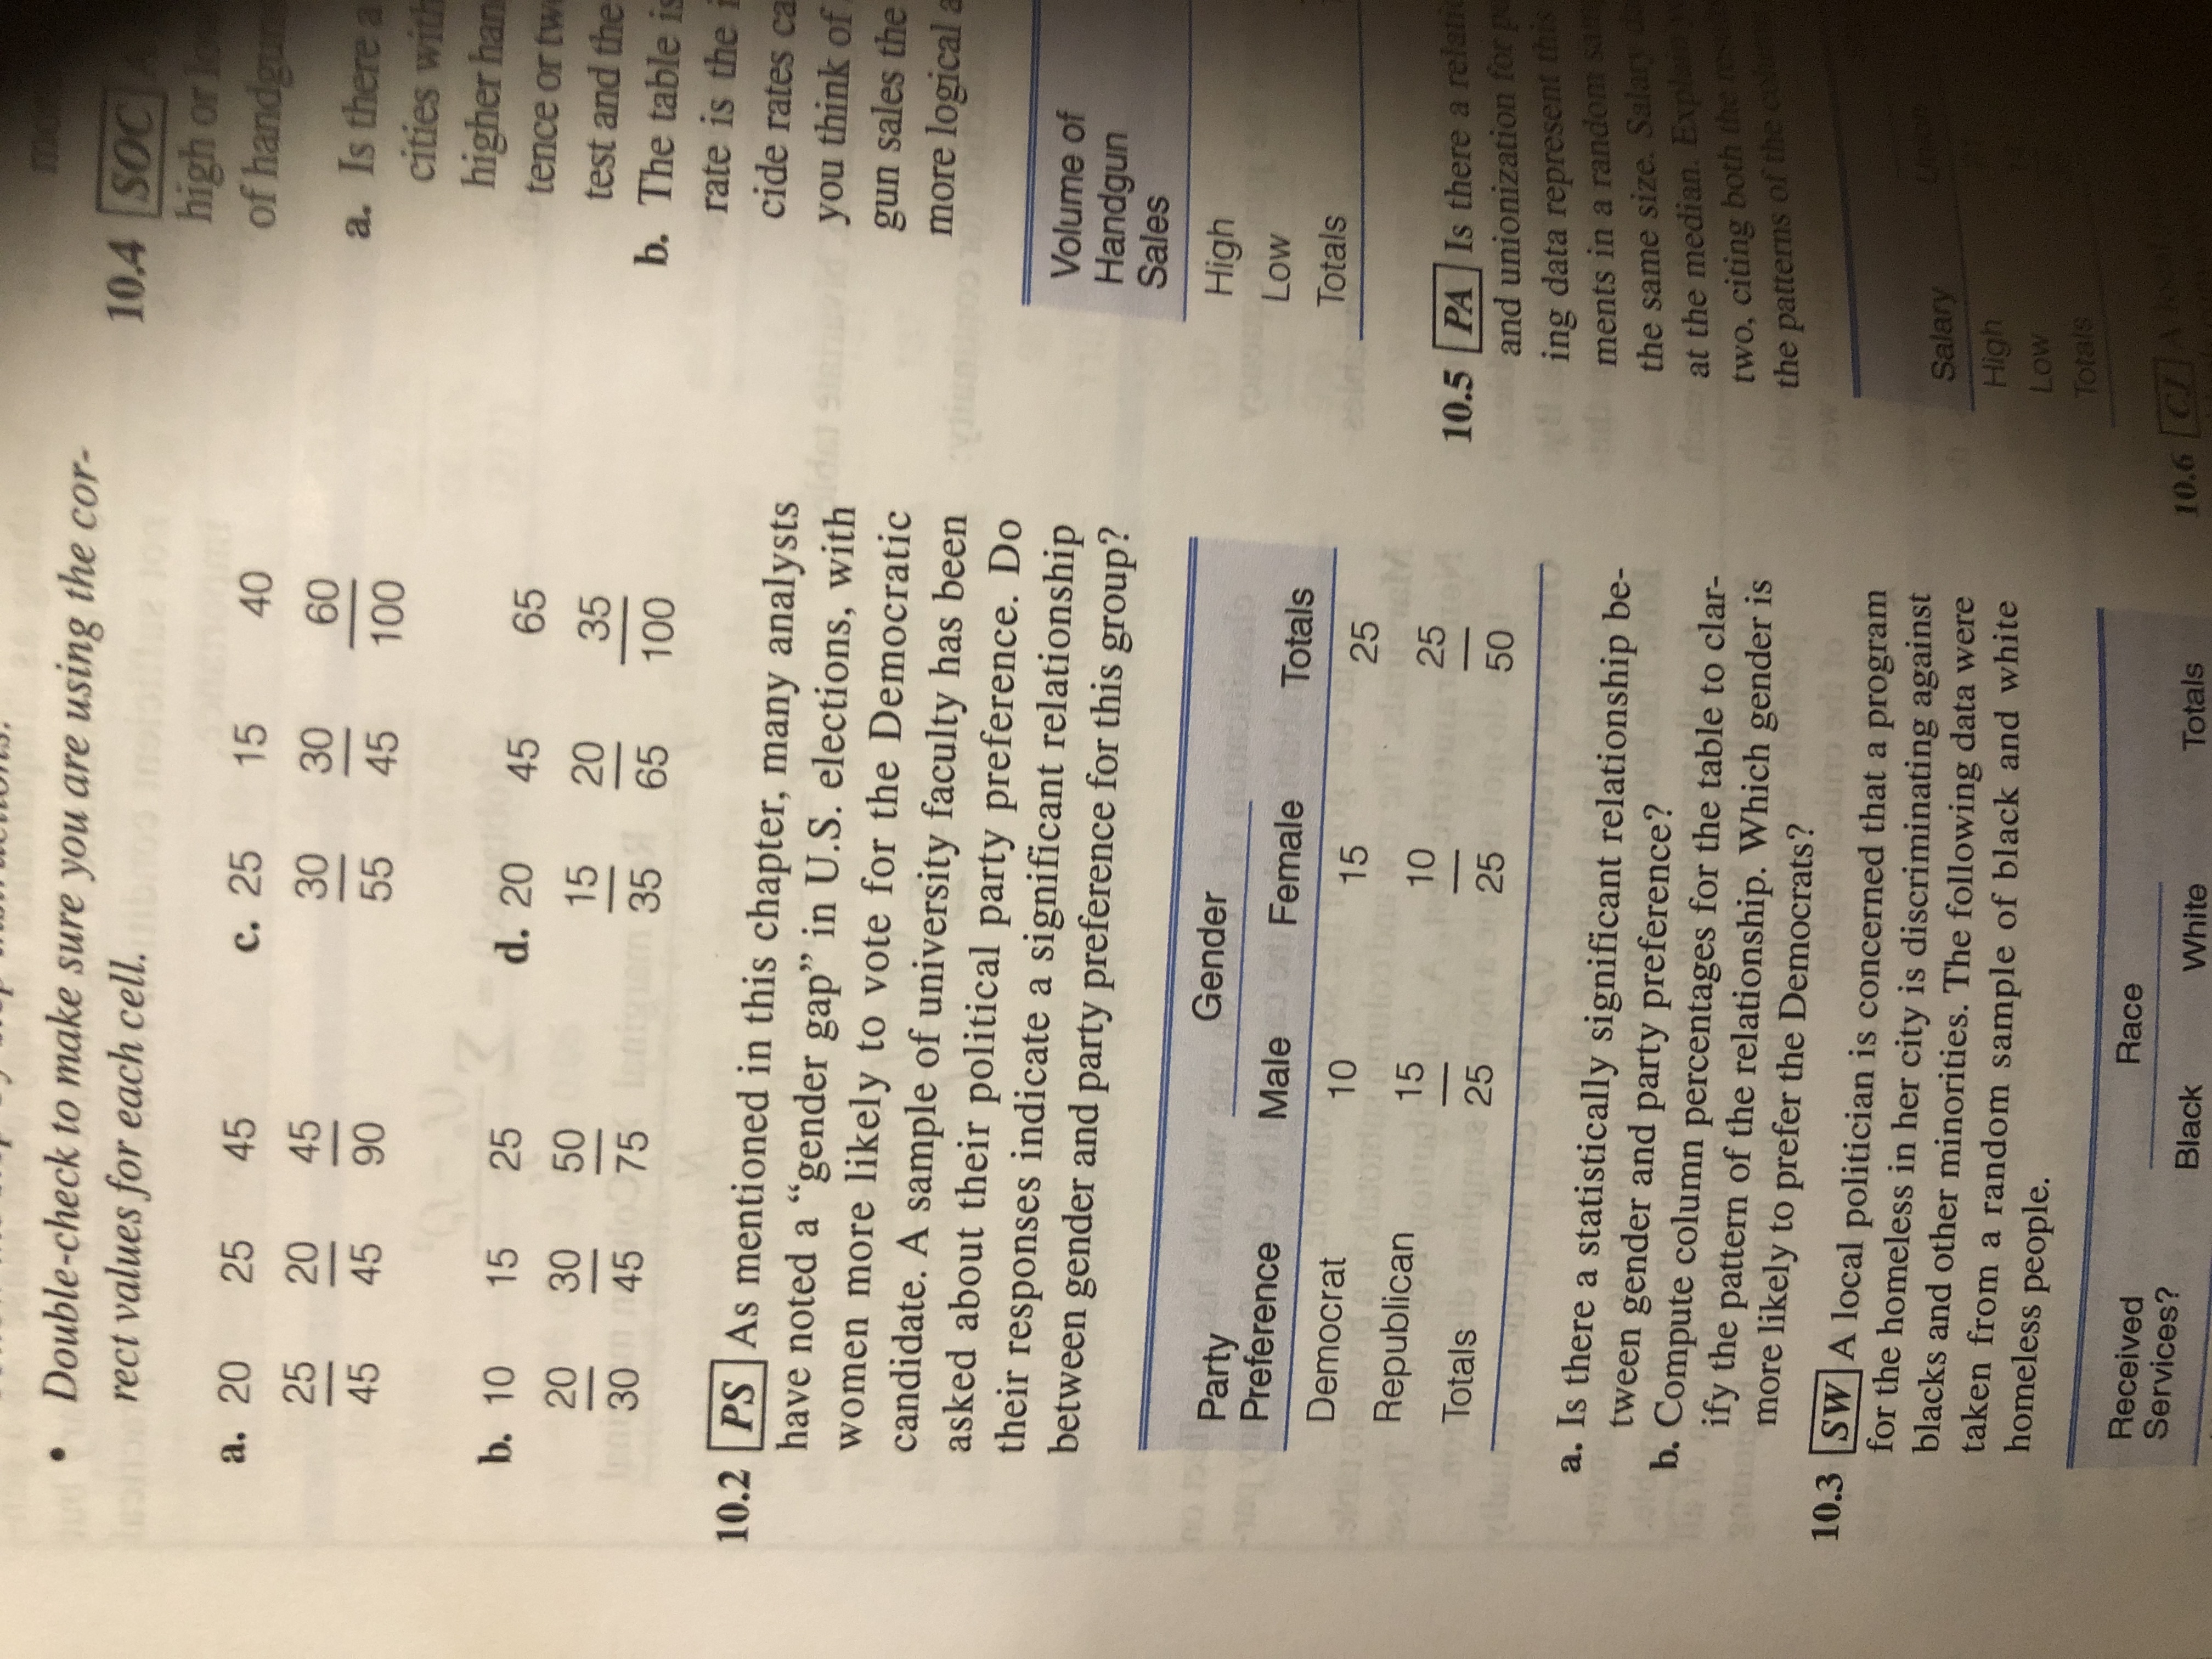
10.2 PS As mentioned in this chapter, many analysts
you think of
gun sales the
more logical a
have noted a “gender gap" in U.S. elections, with
women more likely to vote for the Democratic
candidate. A sample of university faculty has been
asked about their political party preference. Do
their responses indicate a significant relationship
between gender and party preference for this group?
Volume of
Handgun
Sales
Gender
High
Party
Preference
Low
Male
Female
Totals
Totals
Democrat
10
15
25
Republican
15
10
10.5 PA Is there a relatic
and unionization for pe
ing data represent this
ments in a random sam
the same size. Salary da
at the median. Explain
two, citing both the res
nthe patterns of the colu
udd
25
Totals
25
25
50
a. Is there a statistically significant relationship be-
tween gender and party preference?
b. Compute column percentages for the table to clar-
ify the pattern of the relationship. Which gender is
more likely to prefer the Democrats?
10.3 SW A local politician is concerned that a program
for the homeless in her city is discriminating against
blacks and other minorities. The following data were
taken from a random sample of black and white
homeless people.
Unon
Salary
High
Low
Totals
Race
Received
Services?
10.6 CA
Black
White
Totals
Expert Solution
This question has been solved!
Explore an expertly crafted, step-by-step solution for a thorough understanding of key concepts.

This is a popular solution

Trending nowThis is a popular solution!

Step by stepSolved in 9 steps with 7 images

Knowledge Booster


Learn more about
Need a deep-dive on the concept behind this application? Look no further. Learn more about this topic, statistics and related others by exploring similar questions and additional content below.Similar questions
- Two sections of statistics are offered, the first at 8 a.m. and the second at 10 a.m. The 8 a.m. section has 25 women, and the 10 a.m. section has 15 women. A student claims this is evidence that women prefer earlier statistics classes than men do. What information is missing that might contradict this claim? Question content area bottom Part 1 Choose the best answer below. A. The professor may be female in one class and male in the other, which could affect the female students' class preference. B. The percentage of female students in the two classes is unknown. There may be more females in the 8 a.m. because there are more students in the 8 a.m. class than the 10 a.m. class. This claim could be true only if the classes were the same size. C. The age and class standing of the students is unknown. Older female students may prefer later classes, so it may be only younger female students who prefer earlier classes. D. No information is…arrow_forwardPls solve both questions with details explanation and no plagiarism , for good ratingarrow_forwardPlease explain the concept and if you do handwritten i will have to dislike and pls conceptarrow_forward
- ||| O DATA ANALYSIS AND STATISTICS Choosing the best measure to describe data Answer the questions below. (a) The 9 members of a fraternity have the following test scores: 118, 119, 121, 124, 125, 127, 129, 130, 182. Which measure should be used to summarize the data? Mean Median Mode (b) In Prof. Allen's class, the 10 students had the following scores on the last midterm: 128, 130, 131, 132, 135, 136, 141, 142, 143, 144. Which measure should be used to summarize the data? Mean Median Mode (c) Each member of the football team was asked to report the year he was born. Which measure gives the most common year of birth? Mean Median Mode X Śarrow_forwardFor one categorical Variable, what are the appropriate? Summary Statistics Visualizationsarrow_forwardwhen combined with high-quality research designs, statistics provide us with a greater sense of _____ in research personality subjectivity importance objectivityarrow_forward
arrow_back_ios
arrow_forward_ios
Recommended textbooks for you
- MATLAB: An Introduction with ApplicationsStatisticsISBN:9781119256830Author:Amos GilatPublisher:John Wiley & Sons Inc
 Probability and Statistics for Engineering and th...StatisticsISBN:9781305251809Author:Jay L. DevorePublisher:Cengage Learning
 Statistics for The Behavioral Sciences (MindTap C...StatisticsISBN:9781305504912Author:Frederick J Gravetter, Larry B. WallnauPublisher:Cengage Learning
  Elementary Statistics: Picturing the World (7th E...StatisticsISBN:9780134683416Author:Ron Larson, Betsy FarberPublisher:PEARSON
 The Basic Practice of StatisticsStatisticsISBN:9781319042578Author:David S. Moore, William I. Notz, Michael A. FlignerPublisher:W. H. Freeman
 Introduction to the Practice of StatisticsStatisticsISBN:9781319013387Author:David S. Moore, George P. McCabe, Bruce A. CraigPublisher:W. H. Freeman
MATLAB: An Introduction with Applications
Statistics
ISBN:9781119256830
Author:Amos Gilat
Publisher:John Wiley & Sons Inc
Probability and Statistics for Engineering and th...
Statistics
ISBN:9781305251809
Author:Jay L. Devore
Publisher:Cengage Learning
Statistics for The Behavioral Sciences (MindTap C...
Statistics
ISBN:9781305504912
Author:Frederick J Gravetter, Larry B. Wallnau
Publisher:Cengage Learning
Elementary Statistics: Picturing the World (7th E...
Statistics
ISBN:9780134683416
Author:Ron Larson, Betsy Farber
Publisher:PEARSON
The Basic Practice of Statistics
Statistics
ISBN:9781319042578
Author:David S. Moore, William I. Notz, Michael A. Fligner
Publisher:W. H. Freeman
Introduction to the Practice of Statistics
Statistics
ISBN:9781319013387
Author:David S. Moore, George P. McCabe, Bruce A. Craig
Publisher:W. H. Freeman