
MATLAB: An Introduction with Applications
6th Edition
ISBN: 9781119256830
Author: Amos Gilat
Publisher: John Wiley & Sons Inc
expand_more
expand_more
format_list_bulleted
Related questions
Question

Transcribed Image Text:Model
1
Regression
Residual
Model
1
Sum of
Squares
10333.355
24242.384
34575.739
(Constant)
Extraversion
ANOVA
Conscientiousness
Agreeableness
df
Total
a. Dependent Variable: Sales (thousand euros)
b. Predictors: (Constant), Agreeableness, Extraversion, Conscientiousness
3
19
22
34.883
5.149
4.482
.628
Mean Square
3444.452
1275.915
Coefficientsa
Unstandardized Coefficients
B
Std. Error
a. Dependent Variable: Sales (thousand euros)
F
2.700
24.005
2.702
2.613
3.054
Standardized
Coefficients
Beta
.376
.339
.040
Sig.
.075b
t
1.453
1.905
1.716
.205
Sig.
.163
072
.102
.839
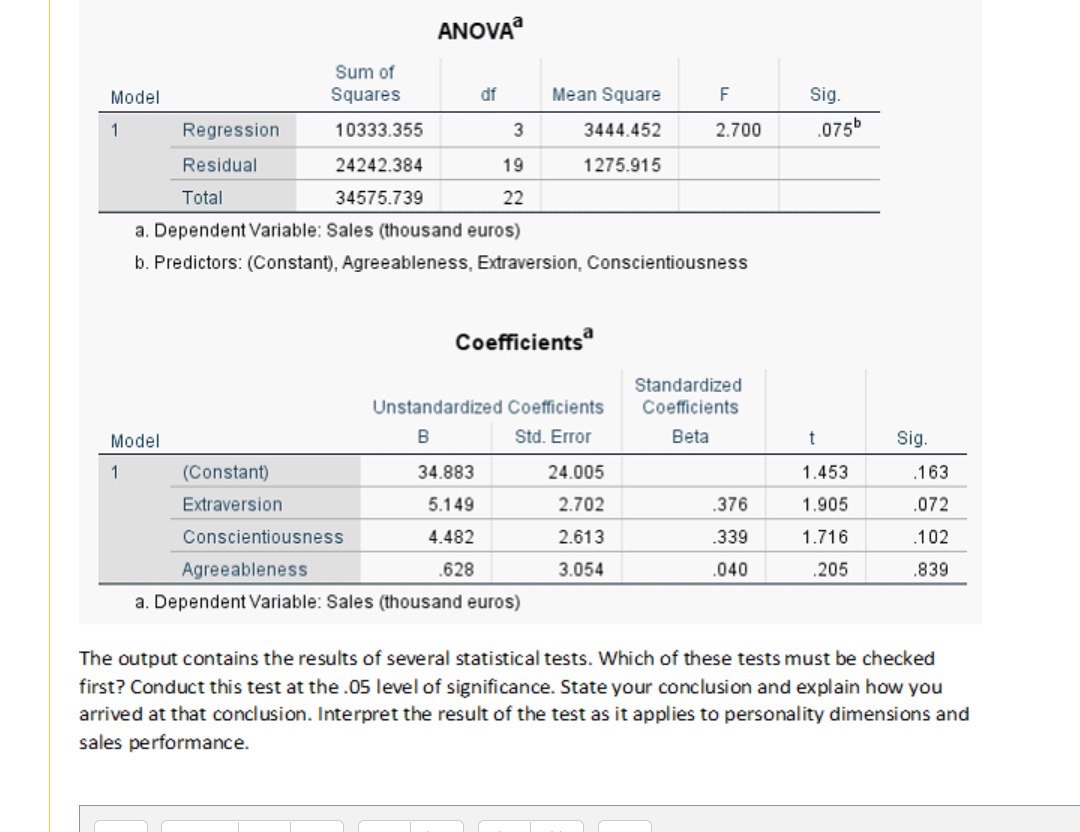
The output contains the results of several statistical tests. Which of these tests must be checked
first? Conduct this test at the .05 level of significance. State your conclusion and explain how you
arrived at that conclusion. Interpret the result of the test as it applies to personality dimensions and
sales performance.

Transcribed Image Text:An HR expert at an insurance company is considering the introduction of personality tests in the
process of recruiting sales agents. It is hypothesised that certain personality traits may contribute to
being a successful sales agent, and therefore personality profiles can be used to select the best
applicants for open positions. The introduction of personality measures in the recruitment process,
however, is only meaningful if there is evidence that certain personality characteristics are related to
job performance. To test whether success in this occupation is related to personality features, the
expert conducts a study, in which a random sample of currently employed sales agents fill in a
questionnaire measuring three traits: (1) extraversion, (2) conscientiousness and (3) agreeableness.
Each trait is measured on a scale ranging between 0 and 10 points. To test whether the annual total
value of insurance policies sold by an agent can be predicted from personality scores, a multiple
linear regression model is constructed, in which an agent's 12-month total sales (in thousand euros)
serve as the dependent variable and the agent's scores on the three personality dimensions function
as the independent variables. The analysis is conducted in SPSS. The printout is shown below.
Model
1
R
.547ª
Model Summary
R Square
.299
Adjusted R
Square
.188
Std. Error of
the Estimate
35.720
a. Predictors: (Constant), Agreeableness, Extraversion,
Conscientiousness
Expert Solution
This question has been solved!
Explore an expertly crafted, step-by-step solution for a thorough understanding of key concepts.

Step by stepSolved in 3 steps

Knowledge Booster

Similar questions
- What is a residual for a multiple regression model and the data that is used to create it? Select one. A statistic that is used to evaluate the significance of the multiple regression model A statistic that explains the relationship between response and predictor variables The predicted value of the response variable using the multiple regression model The difference between the actual value of the response variable and the corresponding predicted value (regression error) using the multiple regression modelarrow_forwardData of variable-A is collected as shown to the right. Is the mean of Variable-A less than 80? State null hypothesis and choose level of significance, a = 0.05. (Use Excel ttest function, provide clear logic and reasoning.) Variable-A Variable-B 78.8 81.9 76.9 78.0 67.8 69.7 68.9 74.7 70.5 70.0 80.0 68.2 63.0 88.7 78.7 86.7 85.4 69.5 87.0 75.1 82.4 71.8 78.2 58.1 76.9 74.8 60.2 93.2 82.6 84.6 67.2 66.5 71.7 77.2 68.9 74.0 69.3 77.7 89.1 78.6 76.3 68.3 74.0 89.0 69.4 82.1 76.3 78.0 66.2 80.3 73.9 82.4 79.1 83.1 80.4 66.4 66.2 67.6 80.9 75.3arrow_forwardHi I need help with the second question "What is the best model using the t-statistic criteria? Select the best answer below and fill in the answer boxes to complete your choice." Please let me know what option to choose from A-G and what numbers to put in the boxes.arrow_forward
- The prediction equation for the data given below is y_hat = -3.98 + 0.56x. What is the residual value when x = 10? 10 2 11 2 15 4 17 0.38 1.62 None Existsarrow_forward21. Least-squares OK? Following is a residual plot produced by MINITAB. Was it appropriate to compute the least-squares regression line? Explain. Residuals Versus x -2 -3 5.0 5.5 6.0 6.5 7.0 7.5 8.0 Residualarrow_forward16arrow_forward
- ANOVA How to write hypotheses for ANOVA How is variance parted in ANOVA? Between Withinarrow_forwardWhat does the slope and the intercept mean in this setting?arrow_forwardWhat is a residual for a multiple regression model and the data that is used to create it? Select one. Question 3 options: A statistic that explains the relationship between response and predictor variables The predicted value of the response variable using the multiple regression model A statistic that is used to evaluate the significance of the multiple regression model The difference between the actual value of the response variable and the corresponding predicted value (regression error) using the multiple regression modelarrow_forward
arrow_back_ios
arrow_forward_ios
Recommended textbooks for you
- MATLAB: An Introduction with ApplicationsStatisticsISBN:9781119256830Author:Amos GilatPublisher:John Wiley & Sons Inc
 Probability and Statistics for Engineering and th...StatisticsISBN:9781305251809Author:Jay L. DevorePublisher:Cengage Learning
 Statistics for The Behavioral Sciences (MindTap C...StatisticsISBN:9781305504912Author:Frederick J Gravetter, Larry B. WallnauPublisher:Cengage Learning
  Elementary Statistics: Picturing the World (7th E...StatisticsISBN:9780134683416Author:Ron Larson, Betsy FarberPublisher:PEARSON
 The Basic Practice of StatisticsStatisticsISBN:9781319042578Author:David S. Moore, William I. Notz, Michael A. FlignerPublisher:W. H. Freeman
 Introduction to the Practice of StatisticsStatisticsISBN:9781319013387Author:David S. Moore, George P. McCabe, Bruce A. CraigPublisher:W. H. Freeman
MATLAB: An Introduction with Applications
Statistics
ISBN:9781119256830
Author:Amos Gilat
Publisher:John Wiley & Sons Inc
Probability and Statistics for Engineering and th...
Statistics
ISBN:9781305251809
Author:Jay L. Devore
Publisher:Cengage Learning
Statistics for The Behavioral Sciences (MindTap C...
Statistics
ISBN:9781305504912
Author:Frederick J Gravetter, Larry B. Wallnau
Publisher:Cengage Learning
Elementary Statistics: Picturing the World (7th E...
Statistics
ISBN:9780134683416
Author:Ron Larson, Betsy Farber
Publisher:PEARSON
The Basic Practice of Statistics
Statistics
ISBN:9781319042578
Author:David S. Moore, William I. Notz, Michael A. Fligner
Publisher:W. H. Freeman
Introduction to the Practice of Statistics
Statistics
ISBN:9781319013387
Author:David S. Moore, George P. McCabe, Bruce A. Craig
Publisher:W. H. Freeman