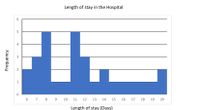
Median = 11
Mean= 11.63
Range =14
Variance = 17.09
Standard deviation = 4.1352
Using the standard normal curve, and the data obtained from the histogram (Listed above), please help me answer the following questions:
Is a patient that stayed X = 10 days considered as being an extreme or typical length of stay? (show all your data analysis and justify your response in one sentence)
What percentage of the patients stayed longer than this? What percentage of the patients stayed less than this? Please show me how to calculate this properly.
b. Is a patient that stayed X = 17 days considered as being an extreme or typical length of stay? (Justify your response in one sentence) What percentage of the patients stayed longer than this? What percentage of the patients stayed less than this?

Trending nowThis is a popular solution!
Step by stepSolved in 2 steps

- Please help me figure this out. Thank you :)arrow_forwardThe annual per capita consumption of oranges (in pounds) in the United States can be approximated by a normal distribution. The mean annual per capita of oranges is 19.2 with a standard deviation of 4 pounds. what annual per capita consumption of oranges represents the 5th percentile?arrow_forwardPlease help me understand the problem. Is the given standard deviations 6, and 7? I know I need to use the unit normal table, and shade the curve. But how? Thanks.arrow_forward
- The heights of adult American men can be modeled by a normal distribution with mean μ = 69 inches and standard deviation σ = 2.5 inches. What height is at the 84th percentile of the distribution?Use the empirical rule and do not round your answer.arrow_forwardThe number of hours per day a college student spends on homework has a mean of 5 hours and a standard deviation of 1 hours. Yesterday she spent 2 hours on homework. How many standard deviations from the mean is that? 3.00 standard deviations below the mean 1.50 standard deviations above the mean 3.00 standard deviations above the mean 1.50 standard deviations below the meanarrow_forward
 MATLAB: An Introduction with ApplicationsStatisticsISBN:9781119256830Author:Amos GilatPublisher:John Wiley & Sons Inc
 Probability and Statistics for Engineering and th...StatisticsISBN:9781305251809Author:Jay L. DevorePublisher:Cengage Learning
 Statistics for The Behavioral Sciences (MindTap C...StatisticsISBN:9781305504912Author:Frederick J Gravetter, Larry B. WallnauPublisher:Cengage Learning
 Elementary Statistics: Picturing the World (7th E...StatisticsISBN:9780134683416Author:Ron Larson, Betsy FarberPublisher:PEARSON
 The Basic Practice of StatisticsStatisticsISBN:9781319042578Author:David S. Moore, William I. Notz, Michael A. FlignerPublisher:W. H. Freeman
 Introduction to the Practice of StatisticsStatisticsISBN:9781319013387Author:David S. Moore, George P. McCabe, Bruce A. CraigPublisher:W. H. Freeman


