
Applications and Investigations in Earth Science (9th Edition)
9th Edition
ISBN: 9780134746241
Author: Edward J. Tarbuck, Frederick K. Lutgens, Dennis G. Tasa
Publisher: PEARSON
expand_more
expand_more
format_list_bulleted
Related questions
Question
I need help with Part A question 1 threw 4

Transcribed Image Text:Travel time (minutes)
5
Location of
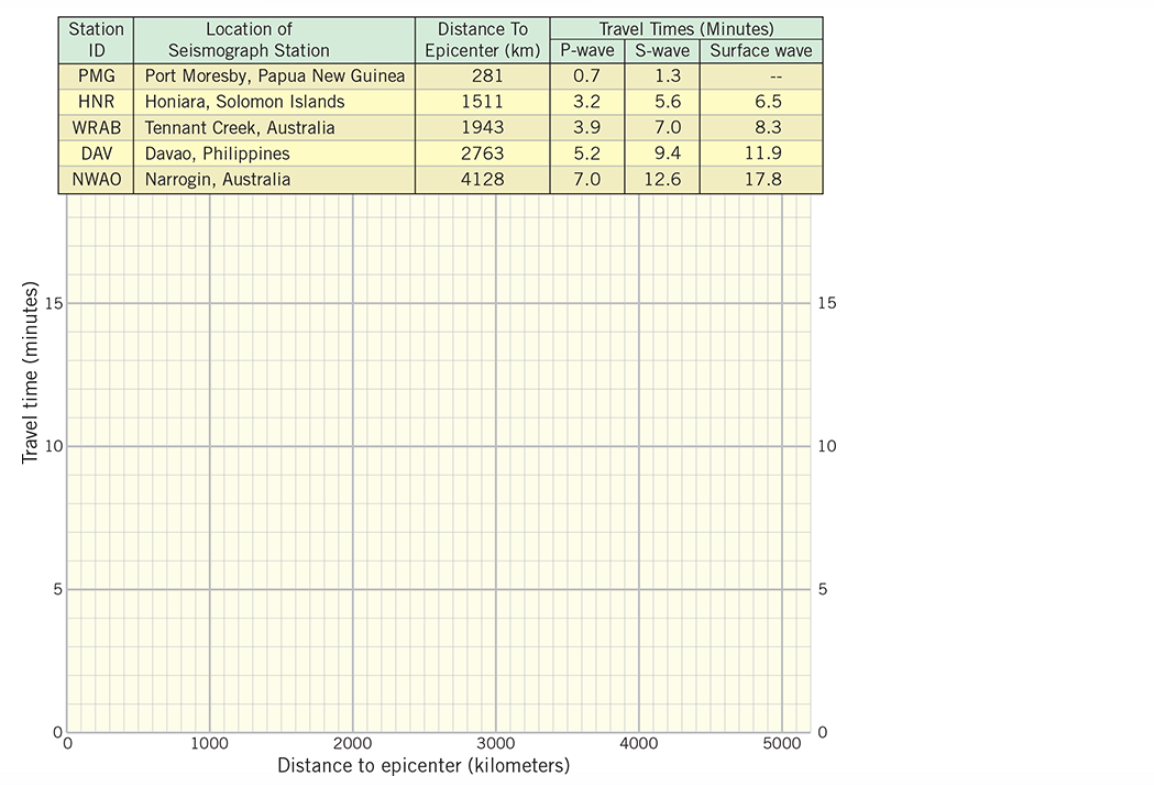
Station
ID
Seismograph Station
PMG Port Moresby, Papua New Guinea
HNR Honiara, Solomon Islands
WRAB Tennant Creek, Australia
DAV Davao, Philippines
NWAO Narrogin, Australia
1000
Distance To
Epicenter (km)
281
1511
1943
2763
4128
Travel Times (Minutes)
P-wave S-wave Surface wave
0.7
1.3
3.2
5.6
3.9
7.0
5.2
9.4
7.0
12.6
2000
3000
Distance to epicenter (kilometers)
4000
6.5
8.3
11.9
17.8
5000
15
10
5

Transcribed Image Text:A. Plot the travel-time data on the graph in Fig. A11.2.1.
1. Use the distance to the epicenter and the travel times to plot the first arrivals for
each of the seismograph stations listed in the table. Use a pencil as you plot each
point carefully, using the grid lines to assist you in interpolating the point location
on the graph.
2. Notice that the points associated with each of the seismic-wave types seem to plot
along a line or curve across the graph, so there seems to be a systematic increase
in travel time with increasing distance from the epicenter. Lightly sketch a line or
curve through the data points you plotted for each type of seismic wave-three
lines/curves in total. Be certain that your lines/curves pass through each of the
data points that you plotted. When you are confident in both the location of the
points you plotted and the lines/curves through those points, darken them so your
teacher can see your work clearly. (Hint: Look at 11.5 for guidance.)
3. Label the curve that represents travel times of P-wave first arrivals. Now do the
same for the two lines/curves associated with S- and surface-wave first-arrivals,
respectively.
4. Briefly explain why these points (and all similar points from other earthquakes)
occur along three discrete lines or curves.
Expert Solution
This question has been solved!
Explore an expertly crafted, step-by-step solution for a thorough understanding of key concepts.

Step by stepSolved in 2 steps with 1 images

Knowledge Booster

Recommended textbooks for you
- Applications and Investigations in Earth Science ...Earth ScienceISBN:9780134746241Author:Edward J. Tarbuck, Frederick K. Lutgens, Dennis G. TasaPublisher:PEARSON
 Exercises for Weather & Climate (9th Edition)Earth ScienceISBN:9780134041360Author:Greg CarbonePublisher:PEARSON
 Environmental ScienceEarth ScienceISBN:9781260153125Author:William P Cunningham Prof., Mary Ann Cunningham ProfessorPublisher:McGraw-Hill Education
  Earth Science (15th Edition)Earth ScienceISBN:9780134543536Author:Edward J. Tarbuck, Frederick K. Lutgens, Dennis G. TasaPublisher:PEARSON
 Environmental Science (MindTap Course List)Earth ScienceISBN:9781337569613Author:G. Tyler Miller, Scott SpoolmanPublisher:Cengage Learning
 Physical GeologyEarth ScienceISBN:9781259916823Author:Plummer, Charles C., CARLSON, Diane H., Hammersley, LisaPublisher:Mcgraw-hill Education,
Applications and Investigations in Earth Science ...
Earth Science
ISBN:9780134746241
Author:Edward J. Tarbuck, Frederick K. Lutgens, Dennis G. Tasa
Publisher:PEARSON
Exercises for Weather & Climate (9th Edition)
Earth Science
ISBN:9780134041360
Author:Greg Carbone
Publisher:PEARSON
Environmental Science
Earth Science
ISBN:9781260153125
Author:William P Cunningham Prof., Mary Ann Cunningham Professor
Publisher:McGraw-Hill Education
Earth Science (15th Edition)
Earth Science
ISBN:9780134543536
Author:Edward J. Tarbuck, Frederick K. Lutgens, Dennis G. Tasa
Publisher:PEARSON
Environmental Science (MindTap Course List)
Earth Science
ISBN:9781337569613
Author:G. Tyler Miller, Scott Spoolman
Publisher:Cengage Learning
Physical Geology
Earth Science
ISBN:9781259916823
Author:Plummer, Charles C., CARLSON, Diane H., Hammersley, Lisa
Publisher:Mcgraw-hill Education,