
Related questions
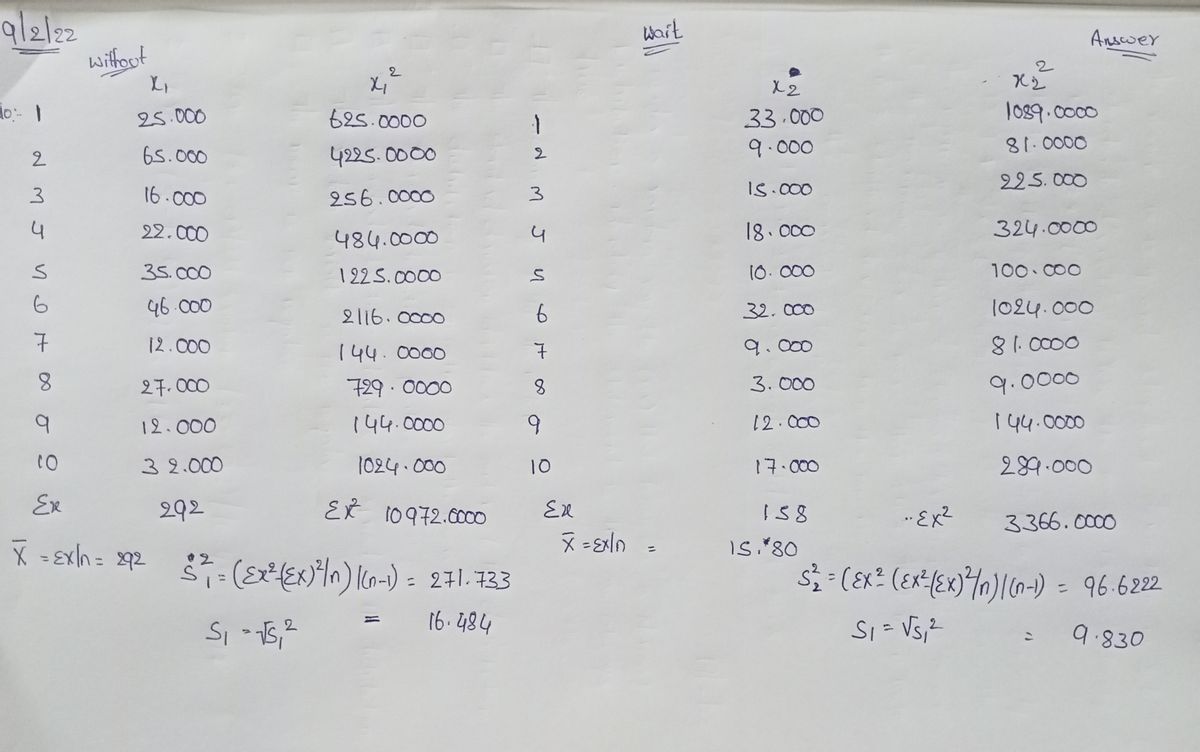
Suppose that the average waiting time for a patient at a physician's office is just over 29 minutes. In order to address the issue of long patient wait times, some physicians' offices are using wait-tracking systems to notify patients of expected wait times. Patients can adjust their arrival times based on this information and spend less time in waiting rooms. The following data show wait times (in minutes) for a sample of patients at offices that do not have a wait-tracking system and wait times for a sample of patients at offices with a wait-tracking system.
Without Wait-
Tracking System With Wait-
Tracking System
25 33
65 9
16 15
22 18
35 10
46 32
12 9
27 3
12 12
32 17

Trending nowThis is a popular solution!

Step by stepSolved in 2 steps with 2 images


- Your statistics instructor often ponders the relationship between commute time and job satisfaction while driving back and forth to campus. Your instructor hypothesizes that people with a shorter commute time will have higher degrees of job satisfaction. Randomly sampling 600 Valley commuters, the instructor finds the following data listed in frequencies: Table 2: Commuters by Length of Commute and Job Satisfaction Job Satisfaction Number Who Commute 20 Minutes or Less Number Who Commute 21 to 40 Minutes Number Who Commute 41 Minutes or More Total Number for Each Level of Job Satisfaction Dissatisfied 10 60 140 210 Neutral 45 59 51 155 Satisfied 145 60 30 235 Total Number for Each Commute Time Range 200 179 221 1. Change frequencies to column percentages.arrow_forwardYou may need to use the appropriate appendix table or technology to answer this question. In a study entitled How Undergraduate Students Use Credit Cards, it was reported that undergraduate students have a mean credit card balance of $3,173. This figure was an all-time high and had increased 44% over the previous five years. Assume that a current study is being conducted to determine if it can be concluded that the mean credit card balance for undergraduate students has continued to increase compared to the original report. Based on previous studies, use a population standard deviation ? = $1,000. (a) State the null and alternative hypotheses. H0: ? < 3,173 Ha: ? ≥ 3,173 H0: ? = 3,173 Ha: ? ≠ 3,173 H0: ? > 3,173 Ha: ? ≤ 3,173 H0: ? ≥ 3,173 Ha: ? < 3,173 H0: ? ≤ 3,173 Ha: ? > 3,173 (b) What is the test statistic for a sample of 170 undergraduate students with a sample mean credit card balance of $3,305? (Round your answer to two decimal places.) What is…arrow_forwardA car wash is assessing the average wait time for its customers. The median wait time is 4 minutes. Does a customer who waits for 5 minutes represent an abnormal wait time? The customer who waits 5 minutes an abnormal case, because 50% of customers wait more than minutes.arrow_forward
- Suppose you are planning to make an account about the study habits of ESTA3041 students. What are the cases in this study?arrow_forwardSleep apnea is a condition in which the sufferers stop breathing momentarily while they are asleep. This condition results in lack of sleep and extreme fatigue during waking hours. A current estimate is that 11.911.9 million out of the 312.7312.7 million Americans suffer from sleep apnea, or approximately 3.8%3.8%. A safety commission is concerned about the percentage of commercial truck drivers who suffer from sleep apnea. They do not have any reason to believe that it would be higher or lower than the population’s percentage. To test the claim that the percentage of commercial truck drivers who suffer from sleep apnea is not 3.8%3.8%, a simple random sample of 347347 commercial truck drivers is examined by a medical expert, who concludes that 66 suffer from sleep apnea. Does this evidence support the claim that the percentage of commercial truck drivers who suffer from sleep apnea is not 3.8%3.8%? Use a 0.020.02 level of significance. Step 3 of 4 : Find the p-value. Round…arrow_forwardc and d pleasearrow_forward
- A statistics content developer at Aplia wanted to know whether study skills are related to memory quality. She invited student volunteers to perform an online memory task. The students saw a list of 60 words and were then asked to recognize a list of 10 words that were on the original list. Students were also asked to provide their GPAs. Consider the following data set, which was collected from student volunteers in 2009. The table gives the frequency for five intervals of scores on the number of correctly identified words. Use the dropdown menus to complete the table by filling in the missing values for the proportions and percentages. Score Interval f Proportion Percentage 9–10 29 0.19 19% 7–8 53 5–6 50 3–4 22 0.14 14% 1–2 1 0.01 1%arrow_forwardThe Wall Street Journal asked Concur Technologies, Inc., an expense management company, to examine data from 8.3 million expense reports to provide insights regarding business travel expenses. Their analysis of the data showed that New York was the most expensive city. The following table shows the average daily hotel room rate (*) and the average amount spent on entertainment (y) for a random sample of 9 of the 25 most-visited U.S. cities. These data lead to the estimated regression equation ŷ = 17.49 +1.0334x. For these data SSE = 1541.4. Click on the datafile logo to reference the data. Use Table 1 of Appendix B. DATA file City Boston Denver Nashville New Orleans Phoenix San Diego San Francisco San Jose Room Rate ($) 148 96 91 110 90 102 136 90 82 Tampa a. Predict the amount spent on entertainment for a particular city that has a daily room rate of $89 (to 2 decimals). $ Entertainment ($) 161 105 101 142 ***** b. Develop a 95% confidence interval for the mean amount spent on…arrow_forward
- MATLAB: An Introduction with ApplicationsStatisticsISBN:9781119256830Author:Amos GilatPublisher:John Wiley & Sons Inc
 Probability and Statistics for Engineering and th...StatisticsISBN:9781305251809Author:Jay L. DevorePublisher:Cengage Learning
 Statistics for The Behavioral Sciences (MindTap C...StatisticsISBN:9781305504912Author:Frederick J Gravetter, Larry B. WallnauPublisher:Cengage Learning
  Elementary Statistics: Picturing the World (7th E...StatisticsISBN:9780134683416Author:Ron Larson, Betsy FarberPublisher:PEARSON
 The Basic Practice of StatisticsStatisticsISBN:9781319042578Author:David S. Moore, William I. Notz, Michael A. FlignerPublisher:W. H. Freeman
 Introduction to the Practice of StatisticsStatisticsISBN:9781319013387Author:David S. Moore, George P. McCabe, Bruce A. CraigPublisher:W. H. Freeman