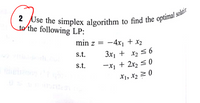
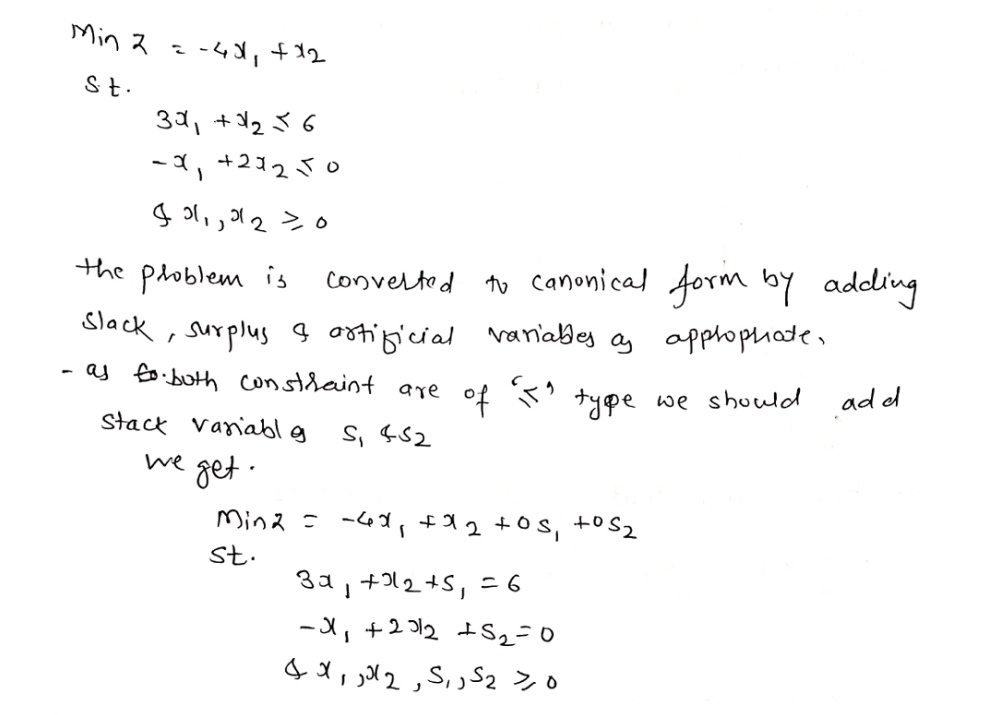
min z = -4x1 + 12 th s.t. 3x, + X2 S s.t. -x, + 2x2 s
Q: Project A Project B Project C Year 1: 15 000 Year 1: 13 000 Year 1: 10 000 Year 2:…
A: Profitability Index AnalysisHere's a step-by way of-step evaluation the usage of the profitability…
Q: A multinational corporation (MNC) has two manufacturing facilities- one in Limerick, the other in…
A: c. Excel Procedure: Enter the data for ‘Limerick’ and ‘Texas’ in Excel sheet. Go to Data Click on…
Q: Pediatrics, Otolaryngology Otitis media is a disease that occurs frequently in the first few years…
A: Given information: The total number of infants is 2500.
Q: 21 25 25 18 44 20 25 15 19 24 10 28 30 25 25 25 25 10 25 25 20 20 20 15 10 20 25 25 13 30 15 28 15…
A: Since you have posted a question with multiple sub-parts, we will solve first three sub-parts for…
Q: star A psychologist is interested in whether a standard anxiety-reduction program (arp) will be…
A: Let X denote the anxiety scores of students obtained before the anxiety reduction program and Y…
Q: Procedure: Review the summary of a published scientific study below: Patients with multiple…
A: " Since you have posted a question with multiple sub-parts, we will solve the first three sub-parts…
Q: What are the values of the coefficient of variation for each year for Product B in the America's New…
A: For Projected Sales 2022: The coefficient of variation formula is, CV=sx¯ In the formula x¯ is…
Q: You may need to use the appropriate appendix table or technology to answer this question. Health…
A:
Q: (c) What is the result of the manager's hypothesis test? O the null hypothesis is rejected. The null…
A: It is required to state the decision of the hypothesis test, and identify whether the result is…
Q: 1. Does having more gun stores in your neighborhood increase the risk of getting shot? Researchers…
A: Since you have posted a question with multiple sub-parts, we will solve first three subparts for…
Q: Discussion 1. Describe the trend(s) shown in your graph. 2. What is the limiting factor in this…
A: Introduction - A line graph - A line graph is a type of chart used to show information that changes…
Q: Proctor & Gamble claims that at least half the bars of Ivory soap they produce are 99.44% pure (or…
A: Sample size (n)=127Number of them meet the 99.44% purity advertised (X)=50Claim : Proctor &…
Q: International representation in the Australian workforce between 1991 and 2031 75% 71.5% 70% 85%…
A: Answer : It has fallen by 8.5%
Q: The following table gives the city and highway mileages (miles per gallon) for 22 two-seaters listed…
A: The independent variable (x) is City The dependent variable (y) is Highway
Q: 5 a. b. C. two examples of the following: Populations Quantitative data Qalitative data.
A: Hi there! Thanks for posting the question. Since there are multiple subparts, we will answer the…
Q: Macmillan Learning STATE: How heavy a load (in pounds) is needed to pull apart pieces of Douglas fir…
A: We will construct a z-interval since the population standard deviation (σ) is known.σ = 3000 pounds…
Q: Independent Activity 1: COMPLETE MY LIST The COVID-19 pandemic tested Filipino's resourcefulness and…
A: Given that: 4 sweet goods: Minasa(M), Ensaymada(E), Inipit(I), Pastillas(P) 2 Beverages: Salabat(S),…
Q: L Downloau Page < 16. One of the goals of psychology is to make accurate predictions about phenomena…
A: Hello thankyou for the question. According to our honor code can answer only three parts at a time.…
Q: he Affordable Care Act (ACA) signed into law by President Barrack Obama in 2010 was the most…
A: 1. The point estimate for the proportion of Americans who want Congress and the President to fix the…
Q: c. Construct and interpret a 95% confidence interval estimate for the difference between…
A: Given that Sample sizes n1 =410 , n2=167 Sample proportion p1^=0.77 , p2^=0.89
Q: 9) More and more weight loss "miracle" drugs have been showing up on the market lately and the FDA…
A: Note: Since you have posted a question with multiple subparts, we will solve the first three…
Q: T₁ (8) T₂ (6) O T3 (7) T4 (4) T5 (9) T6 (3) T7 (2) T8 (5) O T9 (2) O T10 (7) 5. Using the priority…
A: Time 0: There are two processer say P1 and P2 and they are ready to take task, so according to…
Q: Quantitative Question 1 A company has recently released a new tablet and wants to understand what…
A: Given, A company has recently released a new tablet and wants to understand what drives customer…
Q: Intensive care units (ICUS) generally treat the sickest patients in a hospital. ICUs are often the…
A: Mean()=3.5=A random variable x~Exponential()P(Xx)=1-
Q: id out in the field as a 5x5 Latin square, and the following yields (kg DM/plot) were obtained: (see…
A: 62.3 61.3 62.5 63.8 75 64.1 68.4 62.9 66.2 77.4 69.2 55.8 67.8 71.3 74.8 65 68.7 69.8 76 70.9…
Q: ifferentiate the following: Qualitative data in nominal scale and qualitative data in the ordinal…
A:
Q: What are the effects of repeated exposure to an advertising message? The answer may depend on both…
A: There are two types of variables, they are independent and dependent variable. Independent variable…
Q: Two groups of university students were selected to test the effectiveness of a skills enhancement…
A:
Q: COURSE CREDIT HOURS GRADE POINTS EARNED BIO-168 5 C 10 ENG-114 3 B 9…
A:
Q: What is a successful technique applied to service companies? Minimize set-up times Upgrade…
A: Introduce Push system It is a successful technique applied to the service companies.
Q: Consider the following distribution of scores with a mean of 90 and a standard deviation of 30. For…
A: Mean Standard deviation
Q: Understanding the Concepts and Skills Define the following terms: a. Observational study b. Designed…
A: a. Observational study: The investigators may simply observe a predefined set of individuals and…
Q: Does having many internet tabs open affect the completion of a task? Researchers gathered a random…
A: An experimental study is a study where researcher plays an active role and creates a control and…
Q: Gaps in Technical Analysis: Definition, Measurement, and Empirical Evidence
A: Answer : • Technical analysis has been utilized by brokers and examiners for a considerable length…
Q: In the digital age of marketing, special care must be taken to ensure that programmatic ads appear…
A: Given: Marketing Managers Marketing Research Advertising 4 5 9 3 5 10 2 4 9 3 4 8 4 5…
Q: (B) Discuss the effect on the production schedule and the maximum profit if the profit on a slalom…
A:
Q: (a) Find a 90% confidence interval for the mean number of polyester microfibers per 250 mL of beach…
A: a) The provided sample mean is Xˉ=18.3\bar X = 18.3 and the sample standard deviation is s=8.2s =…
Mathmatical operation research
Step by step
Solved in 5 steps with 5 images
- Effective Strategy? A recent survey examines whether recently launched social media strategy is ef- No Yes Total West 20 55 75 fective. Can the retailer conclude that the opinion of the store managers is inde- pendent of region? Test the hypothesis at a = Region Central 15 35 50 East 40 35 75 0.05. Total 75 125 200Estimate sensitivity, specificity, positive predictive value, negative predictive value and prevalence from data in the 2 x 2 table for an infectious disease and its diagnostic test.[Statistics] Use R or RStudio Context of the problem:Fire damage in the United States amounts to billions of dollars, much of it insured. The time taken to arrive at the fire is critical. This raises the question, Should insurance companies lower premiums if the home to be insured is close to a fire station? To help make a decision, a study was undertaken wherein a number of fires were investigated. The distance to the nearest fire station (in miles) and the percentage of fire damage were recorded. Here is the data set: Distance Percent7.5 688.3 666.2 341.6 305.6 706 624.3 478.1 725.7 400.3 531.6 182.5 485.8 535.3 486.3 643.4 526.2 613.2 346.3 656.1 664.6 336.7 760.5 343.2 465.3 555 334.8 466.4 490.2 174.9 476.2 637.6 696.6 542.9 522.1 434.8 358.1 581.2 54.6 464 576.1 400.8 395.9 426.5 626.5 527.5 767.2 676.7 454.1 234 334.8 594…
- ASYNCHRONOUS LEARNING Try to Answer! A. Formulate Ho and Ha 1. Suppose we want to know whether Face-to-face Learning (physical) is more effective than Online Learning (virtual) in teaching high school Mathematics. (Use Form II & V) 2. A Statistics teacher wants to know whether the performance of students in the morning session is better than those of afternoon sessions. (Use Form V) 3. The average monthly income of Nurses in NCR is less than P25,000. (Use Form II & IV) 4. The IQ mean of Grade 11 is equal to 101. A Psychologist would like to find out if there is a significant diffirence from this average. (Use Form I) B. Test the hypothesis 5. The teacher claims that the average grade of Grade 11 students enrolled in Statistics class is equal to 85 with a standard deviation of 7.8. A random sample of 50 students are selected and found out that their mean is 81. The teacher is 95% confident in his claim. a) Formulate the Ho and Ha b) Find a c) Compute the value of statistical test MAT 3…(Q.3) Mastery Assess It 3 - Question is in the photo privided below.Required Information [The following information applies to the questions displayed below.] Davis Stores sells clothing in 15 stores located around the southwestern United States. The managers at Davis are considering expanding by opening new stores and are interested in estimating costs in potential new locations. They believe that costs are driven in large part by store volume measured by revenue. During a discussion, one of the managers suggests that number of employees might be better at explaining cost than store revenues. As a result of that suggestion, managers collected the following information from last year's operations (revenues and costs in thousands of dollars): Store 101 182 103 184 105 Req D1 106 107 108 109 110 111 112 113. 114 115 Intercept Employees Costs $5,740 3,565 5,600 4,327 3,689 2,777 2,821 2,318 2,124 3,090 2,329 5,973 5,257 3,220 5,411 Req D2 Employees 51 49 51 35 38 26 35 37 24 29 28 56 53 53 50 Revenues $2,724 5,096 5,183 2,240 5,519 2,846 3,349 6,340 3,646…
- IG SYSTEM (ACADEMIC) ss Statistics 1 (section50) | Mode can be used either numerical or categorical data Select one: CTrue O False PAGEIntroductory Statistics 3rd edition - 8.34 p-values For each graph, state whether the shaded area could represent a p-value. Explain why or why not. If yes, state whether the area could represent the p-value for a one-sided or a two-sided alternative hypothesis. (images are the graphs)Year Governmenttax revenues(billions of dollars) Governmentexpenditures(billions of dollars) 1 240 240 2 250 245 3 260 255 4 300 320 5 325 340 What is the amount of the surplus or deficit incurred in year 1 by the government shown in the above table? Group of answer choices $0 $25 billion deficit $25 billion surplus $240 billion surplus
- Experimental Methods - Question 30 The particular question is related to Lean Six Sigma Black Belt (MindPro) covering Experimental Methods. Please thoroughly understand the relevant image, and accurately confirm whether the mentioned statement is TRUE or FALSE, by, clearly providing a Justification/Working.Question 19 Lucille, Rocio, and Cristina are all taking College Mathematics but from different professors. They all recently took a statistics exam and the exam scores were normally distributed in each of their classes. • Lucille's class had an average grade of 77 and the standard deviation was 4. Lucille earned 84.2 on the exam. Rocio's class had an average grade of 85 and the standard deviation was 3. Rocio earned 85.6 on the exam. Cristina's class had an average grade of 85 and the standard deviation was 5. Cristina earned 91.5 on the exam. Since some professors give harder exams than others, these students decided to use statistics to figure out who did the best on their exam. Use the Cumulative Z-Score Table to answer the following questions. Write your answers as a percent with two decimal places. Hint • Lucille's score places her above % of her class. % of her class. Rocio's score places her above % of her class. • Cristina's score places her above Which person has the highest…