
MATLAB: An Introduction with Applications
6th Edition
ISBN: 9781119256830
Author: Amos Gilat
Publisher: John Wiley & Sons Inc
expand_more
expand_more
format_list_bulleted
Related questions
Question
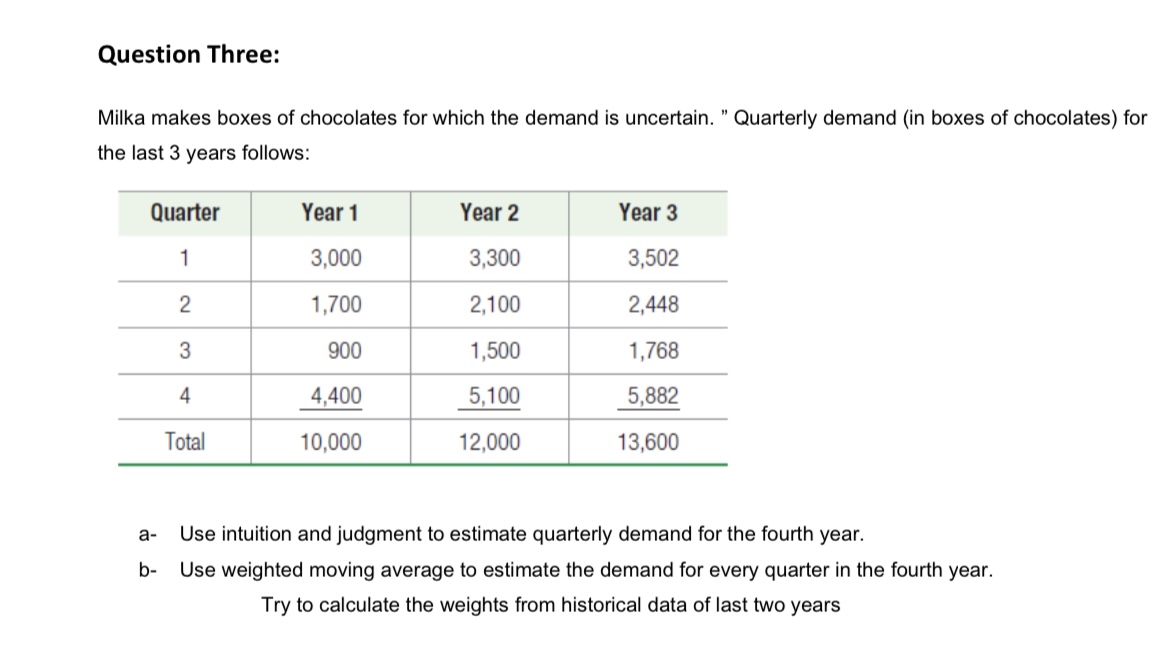

Transcribed Image Text:Question Three:
Milka makes boxes of chocolates for which the demand is uncertain. " Quarterly demand (in boxes of chocolates) for
the last 3 years follows:
Quarter
Year 1
Year 2
Year 3
1
3,000
3,300
3,502
2
1,700
2,100
2,448
900
1,500
1,768
4
4,400
5,100
5,882
Total
10,000
12,000
13,600
a-
Use intuition and judgment to estimate quarterly demand for the fourth year.
b-
Use weighted moving average to estimate the demand for every quarter in the fourth year.
Try to calculate the weights from historical data of last two years
Expert Solution
This question has been solved!
Explore an expertly crafted, step-by-step solution for a thorough understanding of key concepts.

This is a popular solution

Trending nowThis is a popular solution!

Step by stepSolved in 3 steps

Knowledge Booster


Learn more about
Need a deep-dive on the concept behind this application? Look no further. Learn more about this topic, statistics and related others by exploring similar questions and additional content below.Similar questions
- 3- Given the following demand. What is the forecast for period 6 and 18. Period demand base trend forecast (a = .70 and B=.60) 70 80 70 90 110 80 10 4 123 tS6arrow_forwardThe Agri-Food Company has been in business for five years. Brian, the firm's owner, wants to develop a forecast of olive oil sales for the coming year (i.e., 2025) based on the following historical data: Year 2020 2021 2022 2023 2024 Sales 10 20 40 55 75 1. Forecast sales for 2025 using the 3-year moving average method. 2. Forecast sales for 2025 using the simple exponential smoothing method with a smoothing constant of a=0.6. 3. Forecast sales for 2025 using the simple linear trend method.arrow_forwardAssume a company reported the following results: Sales Variable expenses Contribution margin Fixed expenses Net operating income $ 400,000 260,000 140,000 40,000 100,000 Average operating assets $ 500,000 If the company's minimum required rate of return on average operating assets is 16%, its residual income would be: Multiple Choice О $20,000. $21,000. $22,000. $23,000.arrow_forward
- Consider the following. March April May Month Demand. January 29 February March June April July May June July What is the forecast for July based on a three-month weighted moving average applied to the above past demand data and using the weights: data)? Show all the forecasts for April through June along with the answer Month Demand Forecast January 29 February 46 58 59 46 74 58 59 = 74 88 53 10 10 1:35:14 and (largest weight is for most recent 10arrow_forwardThe problem is based on the following data given. Observations of the demand for a certain part stocked at a parts supply depot during the calendar year 2013 were ( as shown ). What would an MA(1) forecasting method mean? Compare the accuracy of MA(1) and MA(4) forecasts for July through December 2013.arrow_forward1. Estimate the retails sales in the U. S. in 2011. billions of dollars = 2. Use the model to predict the year that corresponds to retails sales of $249 billion =arrow_forward
- The following are historical demand data: ACTUAL YEAR 2011 SEASON DEMAND Spring 201 Summer 142 Fall 380 Winter 578 2012 Spring 469 Summer 273 Fall Winter 683 963 Use regression analysis on deseasonalized demand to forecast demand in summer 2013. (Do not round intermediate calculations. Round your answer to the nearest whole number.) Forecast for summer 2013arrow_forwardDevelop a three-period moving average forecast for periods 13-15. Period 10 11 12 13 14 Demand 265 359 436 261 462 Calculate the forecasts for periods 13-15 by using a three-period moving average model (enter your responses rounded to the nearest whole number). Period Demand Forecast 10 265 11 359 12 436 13 261arrow_forward
arrow_back_ios
arrow_forward_ios
Recommended textbooks for you
- MATLAB: An Introduction with ApplicationsStatisticsISBN:9781119256830Author:Amos GilatPublisher:John Wiley & Sons Inc
 Probability and Statistics for Engineering and th...StatisticsISBN:9781305251809Author:Jay L. DevorePublisher:Cengage Learning
 Statistics for The Behavioral Sciences (MindTap C...StatisticsISBN:9781305504912Author:Frederick J Gravetter, Larry B. WallnauPublisher:Cengage Learning
  Elementary Statistics: Picturing the World (7th E...StatisticsISBN:9780134683416Author:Ron Larson, Betsy FarberPublisher:PEARSON
 The Basic Practice of StatisticsStatisticsISBN:9781319042578Author:David S. Moore, William I. Notz, Michael A. FlignerPublisher:W. H. Freeman
 Introduction to the Practice of StatisticsStatisticsISBN:9781319013387Author:David S. Moore, George P. McCabe, Bruce A. CraigPublisher:W. H. Freeman
MATLAB: An Introduction with Applications
Statistics
ISBN:9781119256830
Author:Amos Gilat
Publisher:John Wiley & Sons Inc
Probability and Statistics for Engineering and th...
Statistics
ISBN:9781305251809
Author:Jay L. Devore
Publisher:Cengage Learning
Statistics for The Behavioral Sciences (MindTap C...
Statistics
ISBN:9781305504912
Author:Frederick J Gravetter, Larry B. Wallnau
Publisher:Cengage Learning
Elementary Statistics: Picturing the World (7th E...
Statistics
ISBN:9780134683416
Author:Ron Larson, Betsy Farber
Publisher:PEARSON
The Basic Practice of Statistics
Statistics
ISBN:9781319042578
Author:David S. Moore, William I. Notz, Michael A. Fligner
Publisher:W. H. Freeman
Introduction to the Practice of Statistics
Statistics
ISBN:9781319013387
Author:David S. Moore, George P. McCabe, Bruce A. Craig
Publisher:W. H. Freeman