
MATLAB: An Introduction with Applications
6th Edition
ISBN: 9781119256830
Author: Amos Gilat
Publisher: John Wiley & Sons Inc
expand_more
expand_more
format_list_bulleted
Related questions
Concept explainers
Topic Video
Question
thumb_up100%
Mike Wilde is president of the teachers’ union for Otsego School District. In preparing for upcoming negotiations, he is investigating the salary structure of classroom teachers in the district. He believes there are three factors that affect a teacher’s salary: years of experience, a teaching effectiveness rating given by the principal, and whether the teacher has a master’s degree. A random sample of 20 teachers resulted in the following data.
| Salary | Years | Rating | Masters |
| 31.1 | 8 | 35 | 0 |
| 33.6 | 5 | 43 | 0 |
| 29.3 | 2 | 51 | 1 |
| 43 | 15 | 60 | 1 |
| 38.6 | 11 | 73 | 0 |
| 45 | 14 | 80 | 1 |
| 42 | 9 | 76 | 0 |
| 36.8 | 7 | 54 | 1 |
| 48.6 | 22 | 55 | 1 |
| 31.7 | 3 | 90 | 1 |
| 25.7 | 1 | 30 | 0 |
| 30.6 | 5 | 44 | 0 |
| 51.8 | 23 | 84 | 1 |
| 46.7 | 17 | 76 | 0 |
| 38.4 | 12 | 68 | 1 |
| 33.6 | 14 | 25 | 0 |
| 41.8 | 8 | 90 | 1 |
| 30.7 | 4 | 62 | 0 |
| 32.8 | 2 | 80 | 1 |
| 42.8 | 8 | 72 | 0 |
GIVEN:
| Subscriptions | Web Page Hits | Adv | Price | ||
| Subscriptions | 1 | ||||
| Web Page Hits | 0.642979 | 1 | |||
| Adv | 0.709228 | 0.357179 | 1 | ||
| Price | 0.710019 | 0.253957 | 0.441123 | 1 | |
| ŷ = | 19.915 | + | 0.899 | x1 + | 0.154 | x2 + | (0.667) | x3 |
| ŷ = | 33.647 | or | $33,647 |
FIND: the images below
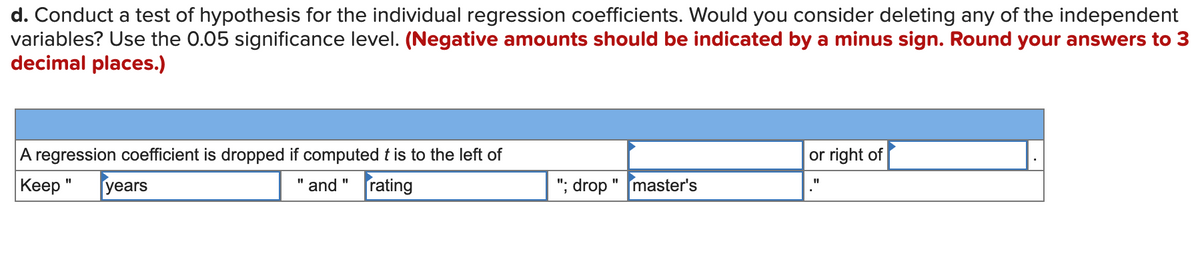

Transcribed Image Text:d. Conduct a test of hypothesis for the individual regression coefficients. Would you consider deleting any of the independent
variables? Use the 0.05 significance level. (Negative amounts should be indicated by a minus sign. Round your answers to 3
decimal places.)
A regression coefficient is dropped if computed t is to the left of
or right of
Keep "
years
" and " rating
"; drop
master's

Transcribed Image Text:e. If your conclusion in part (d) was to delete one or more independent variables, run the analysis again without those variables.
(Round your answers to 4 decimal places.)
Dropping "
master's
we have: Salary =
20.1157 +
0.8927 (years
) +
0.1464 ( rating
).
%3D
Expert Solution
This question has been solved!
Explore an expertly crafted, step-by-step solution for a thorough understanding of key concepts.

This is a popular solution

Trending nowThis is a popular solution!

Step by stepSolved in 4 steps

Knowledge Booster


Learn more about
Need a deep-dive on the concept behind this application? Look no further. Learn more about this topic, statistics and related others by exploring similar questions and additional content below.Similar questions
- Applicants for temporary office work at Carter Temporary Help Agency who have successfully completed an administrative assistant course are then placed in suitable positions by Nancy Dwyer and Darla Newberg. Employers who hire temporary help through the agency return a card indicating satisfaction or dissatisfaction with the work performance of those hired. From past experience it is known that 75% of the employees placed by Nancy are rated as satisfactory, and 65% of those placed by Darla are rated as satisfactory. Darla places 60% of the temporary office help at the agency, and Nancy places the remaining 40%. If a Carter office worker is rated unsatisfactory, what is the probability that he or she was placed by Darla? (Round your answer to three decimal places.)arrow_forwardA sample of 239 adults is selected. The adults are classified according to voter registration status ("registered" or "not registered"). They are also classified according to preferred source of current events information ("television", "newspapers", "radio", or "internet sites"). The results are given in the contingency table below. Television Newspapers Radio Internet sites Registered 46 16 29 36 Not registered 31 20 32 29 What is the relative frequency of adults in the sample who prefer to obtain their information through newspapers? Round your answer to two decimal places.arrow_forwardAs a destination marketing director, you found that TV executives used the guideline that 25% of the viewers were watching Fox cable network, 22% watching NBC and CBS, and 19% watching ABC. The remaining 12% were watching other cable networks such as CNN and MSNBC on a weekday night. A random sample of 500 viewers in the D.C. metro area last Tuesday night showed 109 homes were tuned in to the Fox station, 125 homes tuning in to NBC affiliate, 100 homes tuning in to CBS affiliate and 81 homes tuning in to ABC affiliate. 85 homes were watching CNN and NSNBC cable stations. At the 0.05 significant level, can we conclude that the guideline is still reasonable?arrow_forward
- Sociologists argued that women on average earn less than men as women often choose to work less hours. They further suggest that the choice of hours worked may be driven by various factors such as age, childcare needs, occupation choice and flexibility. To investigate the relation between hours worked and income earned by Australian men and women, a researcher plans to survey a sample of individuals across the country. Briefly explain a) What type of survey method the researcher could use and why? b) What sampling method could the researcher use to select his/her sample and why? c) What are the two main variables the researcher should consider collecting data for the purpose of the above analysis and why? Identify the data type(s) for the variables. d) What kind of issues the researcher may face in this data collection? Suppose a researcher has collected data from a sample of 65 individuals using the sampling method you have proposed in (b). For each individual, the hours worked per…arrow_forwardThe city council of Pine Bluffs is considering increasing the number of police in an effort to reduce crime. Before making a final decision, the council asked the chief of police to survey other cities of similar size to determine the relationship between the number of police and the number of crimes reported. The chief gathered the following sample information. City Police Number of Crimes City Police Number of Crimes Oxford 13 13 Holgate 14 5 Starksville 14 12 Carey 11 16 Danville 20 5 Whistler 9 20 Athens 23 7 Woodville 18 6 Click here for the Excel Data Filea. Determine the regression equation. (Negative amounts should be indicated by a minus sign. Round your answers to 4 decimal places.) b. Estimate the number of crimes for a city with 24 police officers. (Round your answer to the nearest whole number.) c. Interpret the regression…arrow_forwardSierra College students enrolled in an online Elementary Statistics course were asked to participate in an anonymous onlne survey. The survey asked the students "Which type of device will you primarily use to access your online course in Canvas?". Of the 152 students who answered this question, 20 responded "a desktop computer", 121 responded "a laptop computer", 6 responded "a smartphone", and 5 responded "a tablet". The Sierra College Mathematics Department believes that less than 5% of students enrolled in an online Elementary Statistics course primarily uses a smartphone to access their online course in Canvas. Use the data collected in the survey to conduct a hypothesis testing procedure to test this belief. What conclusion should be reached according to the results of this hypothesis test?arrow_forward
- The city council of Pine Bluffs is considering increasing the number of police in an effort to reduce crime. Before making a final decision, the council asked the chief of police to survey other cities of similar size to determine the relationship between the number of police and the number of crimes reported. The chief gathered the following sample information. City Police Number of Crimes City Police Number of Crimes Oxford 15 19 Holgate 17 10 Starksville 17 16 Carey 11 23 Danville 25 8 Whistler 9 27 Athens 28 10 Woodville 21 10 Click here for the Excel Data Filea. Determine the regression equation. (Negative amounts should be indicated by a minus sign. Round your answers to 4 decimal places.) b. Estimate the number of crimes for a city with 20 police officers. (Round your answer to the nearest whole number.)arrow_forwardPolitical parties want to know what groups of people support them. The General Social Survey (GSS) asked its 2014 sample, "Generally speaking, do you usually think of yourself as a Republican, Democrat, Independent, or what?" The GSS is essentially an SRS of American adults. The large two‑way table provided breaks down the responses by the highest degree the subject held. None High School Jr. College Bachelor Graduate Strong Democrat 53 198 23 81 64 Not strong Democrat 52 204 31 70 49 Independent, near Democrat 40 163 26 66 42 Independent 118 251 36 67 30 Independent, near Republican 24 136 19 45 2525 Not strong Republican 19 142 30 71 30 Strong Republican 18 131 15 53 28 Other party 5 31 3 15 8 Use the four‑step process and the full table of counts to analyze the differences in political party support among levels of education. The sample is so large that the differences are bound to be highly significant, but provide the chi‑square statistic and its P‑value…arrow_forward
arrow_back_ios
arrow_forward_ios
Recommended textbooks for you
- MATLAB: An Introduction with ApplicationsStatisticsISBN:9781119256830Author:Amos GilatPublisher:John Wiley & Sons Inc
 Probability and Statistics for Engineering and th...StatisticsISBN:9781305251809Author:Jay L. DevorePublisher:Cengage Learning
 Statistics for The Behavioral Sciences (MindTap C...StatisticsISBN:9781305504912Author:Frederick J Gravetter, Larry B. WallnauPublisher:Cengage Learning
  Elementary Statistics: Picturing the World (7th E...StatisticsISBN:9780134683416Author:Ron Larson, Betsy FarberPublisher:PEARSON
 The Basic Practice of StatisticsStatisticsISBN:9781319042578Author:David S. Moore, William I. Notz, Michael A. FlignerPublisher:W. H. Freeman
 Introduction to the Practice of StatisticsStatisticsISBN:9781319013387Author:David S. Moore, George P. McCabe, Bruce A. CraigPublisher:W. H. Freeman
MATLAB: An Introduction with Applications
Statistics
ISBN:9781119256830
Author:Amos Gilat
Publisher:John Wiley & Sons Inc
Probability and Statistics for Engineering and th...
Statistics
ISBN:9781305251809
Author:Jay L. Devore
Publisher:Cengage Learning
Statistics for The Behavioral Sciences (MindTap C...
Statistics
ISBN:9781305504912
Author:Frederick J Gravetter, Larry B. Wallnau
Publisher:Cengage Learning
Elementary Statistics: Picturing the World (7th E...
Statistics
ISBN:9780134683416
Author:Ron Larson, Betsy Farber
Publisher:PEARSON
The Basic Practice of Statistics
Statistics
ISBN:9781319042578
Author:David S. Moore, William I. Notz, Michael A. Fligner
Publisher:W. H. Freeman
Introduction to the Practice of Statistics
Statistics
ISBN:9781319013387
Author:David S. Moore, George P. McCabe, Bruce A. Craig
Publisher:W. H. Freeman