
MATLAB: An Introduction with Applications
6th Edition
ISBN: 9781119256830
Author: Amos Gilat
Publisher: John Wiley & Sons Inc
expand_more
expand_more
format_list_bulleted
Related questions
Question
critical values
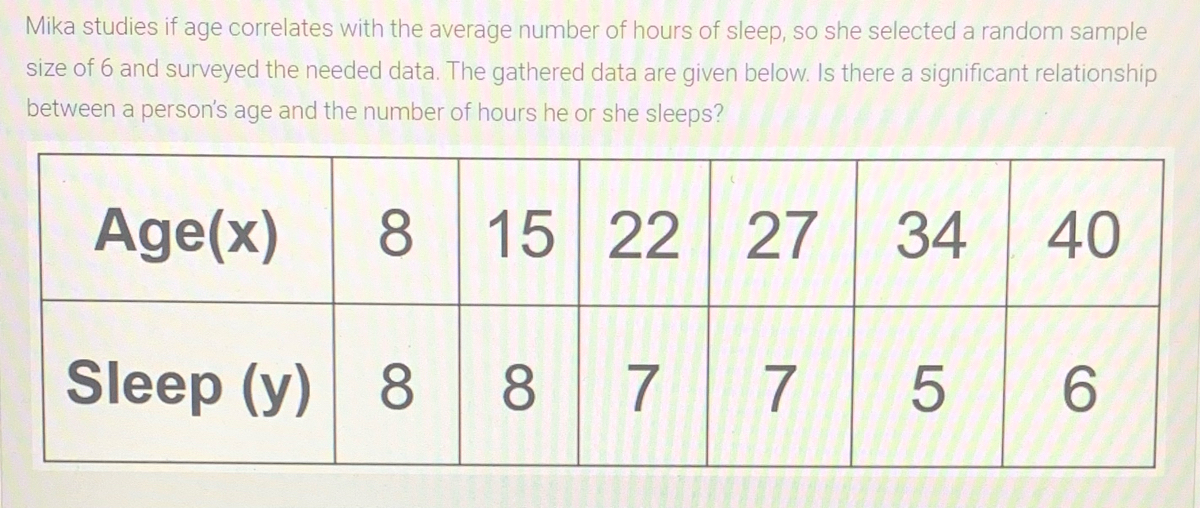

Transcribed Image Text:Mika studies if age correlates with the average number of hours of sleep, so she selected a random sample
size of 6 and surveyed the needed data. The gathered data are given below. Is there a significant relationship
between a person's age and the number of hours he or she sleeps?
Age(x)
8
15 22
27
34
40
Sleep (y) 8
8 7 7
5 6
Expert Solution
This question has been solved!
Explore an expertly crafted, step-by-step solution for a thorough understanding of key concepts.

Step by stepSolved in 2 steps

Knowledge Booster

Similar questions
- The belief that variation in an independent variable will be followed by variation in the dependent variable is known as Group of answer choices a nomothetic causal explanation a linear causal explanation answer is not present a systematic causal explanationarrow_forwardAgricultural companies like to predict how much they can grow per acre based on annual rainfall in inches. Let's assume that an ag company wants to predict indigo yields based on rainfall. What is the response variable? rainfall the ag company indigo yield variety of indigoarrow_forwardCholesterol Levels A medical researcher wishes to see if he can lower the cholesterol levels through diet in 6 people by showing a film about the effects of high cholesterol levels. The data are shown. At a = 0.10, did the cholesterol level decrease on average? Use the critical value method and tables. Patient 1 2 3 4 5 6 Before 244 215 213 221 206 218 After 216 201 194 192 203 214 Send data to Excelarrow_forward
- Using the information below calculate the predicted value for Y for the given value of X. Y (Dependent Variable) = Cost of a house in thousands of dollars (i.e. Y = 1 means one-thousand dollars) X (Independent Variable) = size of the house in hundreds of square feet (i.e. X = 1 means one-hundred square feet) yhat = 10 + 12.3*X On average how many thousands of dollars will a house cost if it is 20 hundred square feet (round your answer to 4 decimal places)?arrow_forwardHW10Q8 P VALUE, CRITICAL VALUE, UPPER AND LOWERarrow_forwardFrequency 45 40 35 30 10 5 O 42 O 55 O no mode O 70 O 22 Use the histogram below to approximate the mode heart rate of adults in the gym. Heart Rates of Adults 55 60 65 70 75 80 85 Heart rate (beats per minute)arrow_forward
- Here is a data set: 396 417 438 444 456 457 457 478 510 521 547 559 589 591 594 595 597 601 602 618 620 660 662 664 667 700 814 831 Construct a frequency distribution table for this data set. • Number of classes: 10 • Use a "nice" class width, such as a multiple of 5 or 10. Label classes using interval notation. o For example, if the class is 70-79, label it as (70,79]. The lower class limit should be a multiple of the class width. o For example, if the class width is 10, the lower class limit should be a number like 30 or 40 (depending on the data).arrow_forwardSON ********** b. Do the organic Dr. Stephanie Andrews (5) Researchers from the University of Miami found that a person's GPA in high school could be an indicator of how much that person will earn later in life. The chart below depicts the findings of the study. Average annual earnings in adulthood, by high school GPA Men $50,000 40,000 30,000 20,000 10,000 0 0.0 Women 0.5 1.0 1.5 2.0 2.5 HIGH SCHOOL GPA SOURCE: University of Miami GRAPHIC: The Washington Post. Published May 20, 2014 3.0 3.5 4.0 4 a. Consider the two variables, High School GPA and Average Annual Earnings in Adulthood. Which is dependent? b. Describe the relationship between High School GPA and Average Annual Earnings in Adulthood. Is the correlation positive or negative? (Write at least two sentences.) c. Does a person's High School GPA cause them to earn a certain salary in adulthood? Explain. (Write at least one sentence.) sta tementarrow_forwardMathematics of Data Management, Analyzing One and Two Variable Dataarrow_forward
- Makeup Unit 7 Assessment Section 1 It mAD = 11z + 19 and mCD= . 13z - 1, find the value of x and the mCD C. D. mCD%=arrow_forwardHow far a person travelled to get an ice cream at Scoops Parlour shop. This represents a discrete variable This represents a continuous variablearrow_forwardcritical values plzarrow_forward
arrow_back_ios
SEE MORE QUESTIONS
arrow_forward_ios
Recommended textbooks for you
- MATLAB: An Introduction with ApplicationsStatisticsISBN:9781119256830Author:Amos GilatPublisher:John Wiley & Sons Inc
 Probability and Statistics for Engineering and th...StatisticsISBN:9781305251809Author:Jay L. DevorePublisher:Cengage Learning
 Statistics for The Behavioral Sciences (MindTap C...StatisticsISBN:9781305504912Author:Frederick J Gravetter, Larry B. WallnauPublisher:Cengage Learning
  Elementary Statistics: Picturing the World (7th E...StatisticsISBN:9780134683416Author:Ron Larson, Betsy FarberPublisher:PEARSON
 The Basic Practice of StatisticsStatisticsISBN:9781319042578Author:David S. Moore, William I. Notz, Michael A. FlignerPublisher:W. H. Freeman
 Introduction to the Practice of StatisticsStatisticsISBN:9781319013387Author:David S. Moore, George P. McCabe, Bruce A. CraigPublisher:W. H. Freeman
MATLAB: An Introduction with Applications
Statistics
ISBN:9781119256830
Author:Amos Gilat
Publisher:John Wiley & Sons Inc
Probability and Statistics for Engineering and th...
Statistics
ISBN:9781305251809
Author:Jay L. Devore
Publisher:Cengage Learning
Statistics for The Behavioral Sciences (MindTap C...
Statistics
ISBN:9781305504912
Author:Frederick J Gravetter, Larry B. Wallnau
Publisher:Cengage Learning
Elementary Statistics: Picturing the World (7th E...
Statistics
ISBN:9780134683416
Author:Ron Larson, Betsy Farber
Publisher:PEARSON
The Basic Practice of Statistics
Statistics
ISBN:9781319042578
Author:David S. Moore, William I. Notz, Michael A. Fligner
Publisher:W. H. Freeman
Introduction to the Practice of Statistics
Statistics
ISBN:9781319013387
Author:David S. Moore, George P. McCabe, Bruce A. Craig
Publisher:W. H. Freeman