
A First Course in Probability (10th Edition)
10th Edition
ISBN: 9780134753119
Author: Sheldon Ross
Publisher: PEARSON
expand_more
expand_more
format_list_bulleted
Related questions
Question
Number 3 only
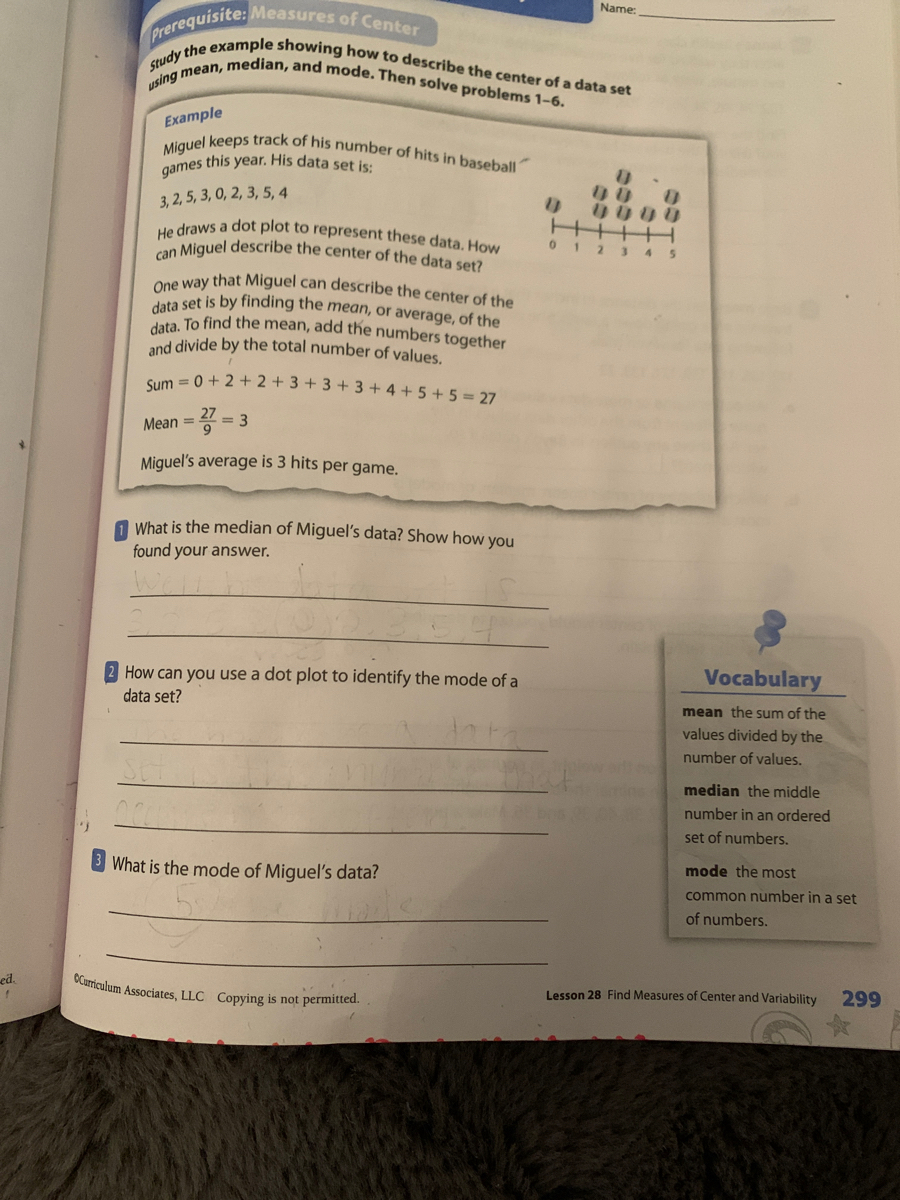

Transcribed Image Text:Prerequisite: Measures of Center
Miguel keeps track of his number of hits in baseball
can Miguel describe the center of the data set?
data. To find the mean, add the numbers together
Study the example showing how to describe the center of a data set
using mean, median, and mode. Then solve problems 1-6.
OCurriculum Associates, LLC Copying is not permitted.
Name:
Example
this year. His data set is:
games
3, 2, 5, 3, 0, 2, 3, 5, 4
n draws a dot plot to represent these data, How
0000
1 2
One way that Miguel can describe the center of the
ta set is by finding the mean, or average, of the
and divide by the total number of values
Cum = 0 + 2 + 2 +3 + 3 + 3+ 4 +5 ++ 5 = 27
27
Mean =
= 3
9.
Miquel's average is 3 hits per game.
What is the median of Miguel's data? Show how you
found your answer.
2 How can you use a dot plot to identify the mode of a
Vocabulary
data set?
mean the sum of the
values divided by the
number of values.
median the middle
number in an ordered
set of numbers.
What is the mode of Miguel's data?
mode the most
common number in a set
of numbers.
ed.
Lesson 28 Find Measures of Center and Variability
299
Expert Solution
This question has been solved!
Explore an expertly crafted, step-by-step solution for a thorough understanding of key concepts.

Step by stepSolved in 2 steps

Knowledge Booster


Learn more about
Need a deep-dive on the concept behind this application? Look no further. Learn more about this topic, probability and related others by exploring similar questions and additional content below.Similar questions
arrow_back_ios
arrow_forward_ios
Recommended textbooks for you
- A First Course in Probability (10th Edition)ProbabilityISBN:9780134753119Author:Sheldon RossPublisher:PEARSON

A First Course in Probability (10th Edition)
Probability
ISBN:9780134753119
Author:Sheldon Ross
Publisher:PEARSON