
MATLAB: An Introduction with Applications
6th Edition
ISBN: 9781119256830
Author: Amos Gilat
Publisher: John Wiley & Sons Inc
expand_more
expand_more
format_list_bulleted
Related questions
Question
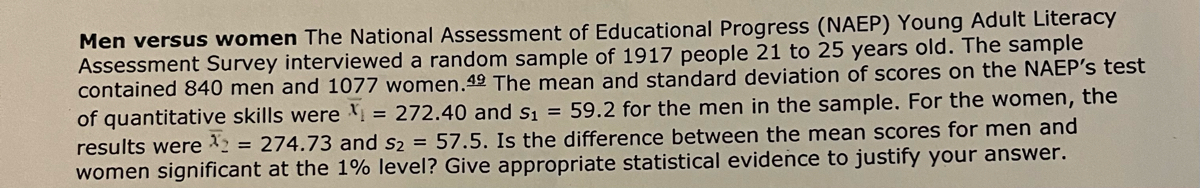

Transcribed Image Text:Men versus women The National Assessment of Educational Progress (NAEP) Young Adult Literacy
Assessment Survey interviewed a random sample of 1917 people 21 to 25 years old. The sample
contained 840 men and 1077 women. 49 The mean and standard deviation of scores on the NAEP's test
of quantitative skills were = 272.40 and si = 59.2 for the men in the sample. For the women, the
results were 2 = 274.73 and s2 = 57.5. Is the difference between the mean scores for men and
women significant at the 1% level? Give appropriate statistical evidence to justify your answer.
Expert Solution
This question has been solved!
Explore an expertly crafted, step-by-step solution for a thorough understanding of key concepts.

This is a popular solution

Trending nowThis is a popular solution!

Step by stepSolved in 4 steps with 4 images

Knowledge Booster

Similar questions
- The manager of a major retail store has taken a random sample of 25 customers. The average sale was $52.50. The population standard deviation is known to be $6.10. The manager would like to determine whether or not the mean sales by all customers are significantly more than $50. What is the p-value for the test?arrow_forwardAn IQ test has a mean of 96 and a standard deviation of 15. Which is more unusual, an IQ of 81 or an IQ of 120?arrow_forwardAn instructor claims that the average number of hours needed to study for a final exam in order to pass should be 5 hours. A student believes that the instructor is understating the number of hours needed to pass and surveys 36 students and finds the sample mean and standard deviation to be 5.7 and 1.5 hours respectively. Test the instructors claim at a .10 level.arrow_forward
- In 1974, the mean height of a woman in the United States was 63.7 inches, with a standard deviation of 2.5 inches. What is the height of a woman who is taller than 88% of the rest of the sample? Enter your answer in inches rounded to one decimal place, e.g. 60.4.arrow_forwardFind the mean and standard deviation of the number of red-headed Scots in a randomly selected group of 155. The probability of having red hair is still 13% for Scottish people. a. Mean = b. Standard deviation (Round to 2 places)=arrow_forwardA company wants to assess the average time it takes for customers to complete a particular task on their website. They collect the following data from a sample of 10 customers: 5, 6, 7, 8, 9, 10, 10, 11, 12, 13 minutes. Calculate the sample mean and standard deviation for this data.arrow_forward
- In the class of 2019, more than 1.6 million students took the SAT. The distribution of scores on the math section (out of 800) is approximately normal with a mean of 528 and standard deviation of 117. What proportion of students earned scores between 500 and 600 on the SAT math test?arrow_forwardThe mean height of male college students in a large city is 68 inches and the standard deviation is 5 inches. What height would a male college student must have in order for the student's height to be the cutoff point for the 95th percentile? (What is the lowest height in the top 5%?)arrow_forwardTLe Citu University of 3. Find the standard deviation for the following sample data: Freq. 6. 7 8. 8. 1 6. 10 4 3.arrow_forward
- If the standard deviation of a sample is 4.3 for 28 data values, what would the standard deviation be for the population from which the sample was drawn?arrow_forwardjoans finishing time for the bolder boulder 10k race was 1.77 standard deviations faster than the womens average for her age group. there were 415 women in her group. assuming a normal distribution, how many women ran faster than joan? rounded down to the nearest whole numberarrow_forward
arrow_back_ios
arrow_forward_ios
Recommended textbooks for you
- MATLAB: An Introduction with ApplicationsStatisticsISBN:9781119256830Author:Amos GilatPublisher:John Wiley & Sons Inc
 Probability and Statistics for Engineering and th...StatisticsISBN:9781305251809Author:Jay L. DevorePublisher:Cengage Learning
 Statistics for The Behavioral Sciences (MindTap C...StatisticsISBN:9781305504912Author:Frederick J Gravetter, Larry B. WallnauPublisher:Cengage Learning
  Elementary Statistics: Picturing the World (7th E...StatisticsISBN:9780134683416Author:Ron Larson, Betsy FarberPublisher:PEARSON
 The Basic Practice of StatisticsStatisticsISBN:9781319042578Author:David S. Moore, William I. Notz, Michael A. FlignerPublisher:W. H. Freeman
 Introduction to the Practice of StatisticsStatisticsISBN:9781319013387Author:David S. Moore, George P. McCabe, Bruce A. CraigPublisher:W. H. Freeman
MATLAB: An Introduction with Applications
Statistics
ISBN:9781119256830
Author:Amos Gilat
Publisher:John Wiley & Sons Inc
Probability and Statistics for Engineering and th...
Statistics
ISBN:9781305251809
Author:Jay L. Devore
Publisher:Cengage Learning
Statistics for The Behavioral Sciences (MindTap C...
Statistics
ISBN:9781305504912
Author:Frederick J Gravetter, Larry B. Wallnau
Publisher:Cengage Learning
Elementary Statistics: Picturing the World (7th E...
Statistics
ISBN:9780134683416
Author:Ron Larson, Betsy Farber
Publisher:PEARSON
The Basic Practice of Statistics
Statistics
ISBN:9781319042578
Author:David S. Moore, William I. Notz, Michael A. Fligner
Publisher:W. H. Freeman
Introduction to the Practice of Statistics
Statistics
ISBN:9781319013387
Author:David S. Moore, George P. McCabe, Bruce A. Craig
Publisher:W. H. Freeman