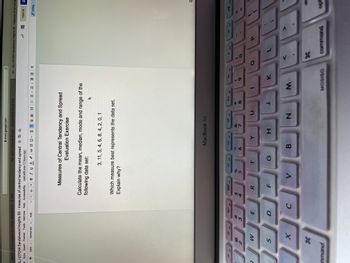
Measures of Central Tendency and Spread Evaluation Exercise Calculate the mean, median, mode and range of the following data set: 3, 11, 5, 4, 6, 8, 4, 2, 0, 1
Q: Show the five-number summary for the following data: 5, 16, 18, 9, 7, 12, 17, 9, 5. minimum first…
A:
Q: Find Interquartile Range (IQR) for the following set of data: 22,32,37,33,33,40,39,47,38
A: We have given the data set: 22 32 37 33 33 40 39 47 38 n=9
Q: 4. Determine the quartiles for the following data set. 107, 109, 102, 113, 102, 110, 108, 104, 116,…
A:
Q: Give 2 examples of Mode in Measure of central tendency to grouped data
A: 1)The following table represents the number of times that 100 randomly selected students ate at the…
Q: Calculate the MEAN, MODE and MEDIAN for each data set.
A: Here Given the data for two schools number of exclusion.
Q: which measure of central tendency mean or median best describe the center of the distribution and…
A: Given query is to find the measure which is best to describe center of the distribution.
Q: 10 11 12 13 15 15 16 17 18 18 What is the mean median and mode of this data in descriptive stat
A: Consider, X = 10, 11, 12, 13, 15, 15, 16, 17, 18, 18 The mean for the provided data set can be…
Q: Test scores for a college statistics class on a certain day are as follows: 99, 56, 78, 55.5, 32 90,…
A:
Q: find out mean median and mode for given data 1,5,6,7,45,78,98,,85,56,78
A:
Q: The number of credits being taken by a sample of 13 full-time college students are listed below.…
A: We have given that the sample of 13 full-time college students. The data is 7 9 10 10 7 8 6 6 6 6 6…
Q: Major cities around the world compete with each other to attract new businesses. Some of the…
A: Givensample size(n)=61Mean(x)=3.72sample standard deviation(s)=0.65significance level(α)=0.01
Q: y-Values that would form the summary points of the median-med for the dataset in the table. y 15 16…
A: To find the three median y-values that would form the summary points of the median-median line:…
Q: Use the following box plots to answer questions 5 and 6. Here are two box plots: 95 100 105 110 115…
A: 5. The median is represented by middle bar in the box of the given box plot. So, from the two…
Q: A. Find the mean, median, mode, Q,, Q3, D9, P38, and P7 of each of the following data sets. Make a…
A: Hello! As you have posted 3 different questions, we are answering the first question with 3 sub…
Q: Calculation of a mean, median, and mode on a new data set could be an activity of an overall…
A: Calculating the mean, median, and mode is a common part of exploratory data analysis (EDA), which is…
Q: Please show all your work. A department store wants to estimate the mean monthly sales of its…
A: Given information: Number of the stores Sample chosen A 50 B 40 C 10 Sample size…
Q: which data set has the highest variability? 3,3,4,4,4,2,3 1,1,1,1,1,2,2,7…
A: Measure of central tendency measures the central or average value of a dataset. Measured of…
Q: minimum, Q1, Q2 (median), Q3, maximum, using the following data sets. Choose the incorrect answer…
A: Given data values are ,45, 58, 34, 42, 52, 49, 50, 45, 51We have to find the value of Maximum , Q1 ,…
Q: (C) Is the mode a good measure of center for this data set? O Yes O No (d) Is the distribution…
A: c) No, here based one mean, median and mode values we could see the data was skewed, so the median…
Q: , median, mode and standard deviation for this data set.
A: 3,7,8,6,6,9,10,5,1,10,8,5,5,7Mean = [sum of the terms] / [number of the terms]Mode = Median = middle…
Q: What is the most informative (useful) measure of central tendency of the yearly income of employees…
A: It is given that the statement about to the measure of central tendency. Here, need to find out the…
Q: (1) Find the mean, median and mode of given data 9,5,8,9,9,7,8,9,8
A: The mean for the dataset is calculated by dividing the sum of all data points, with the number of…
Q: Fig. 4 Comparison of Outcome Types (Cats vs. Dogs) 30000 25000 20000 15000 10000 5000 Adoption…
A: The given graph shows about the number of cats and dogs adopted, euthanized and returned. Cats: The…
Q: calculate the coefficient of range separately for the two sets of data given below set 1…
A: Answer : From the given data, set 1 : 7,11,9,12,15,20,4,25 set 2 : 19,22,25,30,36,45,55,59 Now, The…
Q: Which list of measures of central tendency represents the ranking from most to least affected by…
A:
Q: a? stem-and-leaf plot of the test scores 67,72,85,75,89,89,87,90,98,100. How does the? stem-and-leaf…
A: Given: The data are given in this case: 67,72,85,75,89,89,87,90,98,100
Q: A set of data is summarized by the stem and leaf plot below. Stem Leaf 112344 55 7 8 8 9 2 0124 6 8…
A: The observations in the data set are…
Q: what are the first quartile median and third quartile of this data set? 19…
A: Observations in the ascending order are :16,17,19,24,28,30,31,32,36,37,40,43,45Here, n=13 is odd.M=…
Q: Here is a FDT for a small data set: data freq 45 2 46 4 47 2 48 3 49 9Find the following measures of…
A: We have given that, The data set are :- Data (x) frequency (f) 45 2 46 4 47 2 48 3…
Q: How do I attach an Excel or SPPS.sav data set to this question window?
A: Ensure that you have the field titles, i.e. variable names, in row 1 at the top of each column of…
Q: Determine the distribution of the data pictured below Uniform Bell-shaped Skewed-right Skewed-left
A:
Q: Grand Jury indictment data for Gloucester Country, New Jersey, are published every week in the…
A: Given information: Sample size n=11 The following data are the given number of indictments for a…
Q: Alustration 10. Obtain the value of median from the following data: 753, 522, . 777, 91, 384, 591,…
A:
Q: Find the (a) mean, (b) median, (c) mode, and (d) midrange for the data and then (e) answer the…
A: Since you have posted a question with multiple sub-parts, we will solve first three subparts for…
Q: (a) Which average represents the middle value of a data distribution? A. mode B. median C. mean…
A: to solve the MCQs
Q: Assuming the population variances are equal, is there evidence that the mean brand value is…
A: The question is about hypothesis testing.Given :No. of observations in the technology sector ( n1 )…
Q: Find the (a) mean, (b) median, (c) mode, and (d) midrange for the data and then (e) answer the given…
A: Since you have posted a question with multiple sub-parts, we will solve first three subparts for…
Q: Find the (a) mean, (b) median, (c) mode, and (d) midrange for the data and then (e) answer the…
A: Given data 10.5, 9.3, 9.2, 9.3, 9.8, 8.8, 10.3, 8.6, 8.9, 9.2, 9.2
Q: find range and population variance for given data 45,56,12,1,3,4,5,67,89,78,45,25,87
A:
Q: The CEO of a small company earns $400,000 per year, and the 10 employees each earn $50,000 per year.…
A: Here, the CEO of a small company earns $400,000 per year, and the 10 employees each earn $50,000 per…
Step by step
Solved in 3 steps with 1 images
- Draw the box-and-whisker plot and give the five-number summary for each data set. Number of games won by the Detroit Lions in their last 10 seasons: minumim:________ (9,7,11,7,4,10,6,2,0,7) Lower Quartile:________ Median:______________ Upper Quartile:_____________ Maximum_______________mean median mode and range 1,1,7,3,2,2,3,5.Which one of the cumulative frequencies can be taken while calculating median of the grouped data? a. Succeeding cumulative frequency of the median class O b. Cumulative Frequency of the median class O c. Preceding cumulative frequency of the median class O d. Cumulative frequency is not considered in median
- What kind of analysis involves discussing the center of the data in a sample (e.g., the mean or median) and how the data is spread out? A Discrete B Descriptive Inferential D Qualitative E ContinuousThe accompanying table contains the overall download and upload speeds in mbps for nine carriers in a particular country. a. Compute the mean and median. Data table The mean download speed is (Type an integer or decimal rounded to two decimal places as needed.) Carrier Download Speed Upload Speed Carrier 1 22.7 14.9 The mean upload speed is. (Type an integer or decimal rounded to two decimal places as needed.) Carrier 2 22.0 12.9 Carrier 3 20.7 8.8 The median download speed is. Carrier 4 16.6 11.1 (Type an integer or decimal rounded to two decimal places as needed.) Carrier 5 11.5 6.1 Carrier 6 9.9 6.5 The median upload speed is. (Type an integer or decimal rounded to two decimal places as needed.) Carrier 7 10.6 6.5 Carrier 8 6.7 3.0 b. Compute the variance, standard deviation, range, and coefficient of variation. Carrier 9 4.3 3.9 The variance for the download speeds is. (Type an integer or decimal rounded to two decimal places as needed.) Print Dore P Type here to search 7. 3. T Y.…DO THIS TYPEWRITTEN FOR UPVOTE YOU MAY DO HANDWRITTEN BUT NO UPVOTE