
MATLAB: An Introduction with Applications
6th Edition
ISBN: 9781119256830
Author: Amos Gilat
Publisher: John Wiley & Sons Inc
expand_more
expand_more
format_list_bulleted
Related questions
Concept explainers
Question
thumb_up100%
Can someone please help me on interpreting my solved solutions for a, b, c, and d areas. I am still confused as to how I can properly interpret. There isn't a need to solve, just a simple help in me understanding my results. (Please read carefully, there's four differing sections)

Transcribed Image Text:Observations from
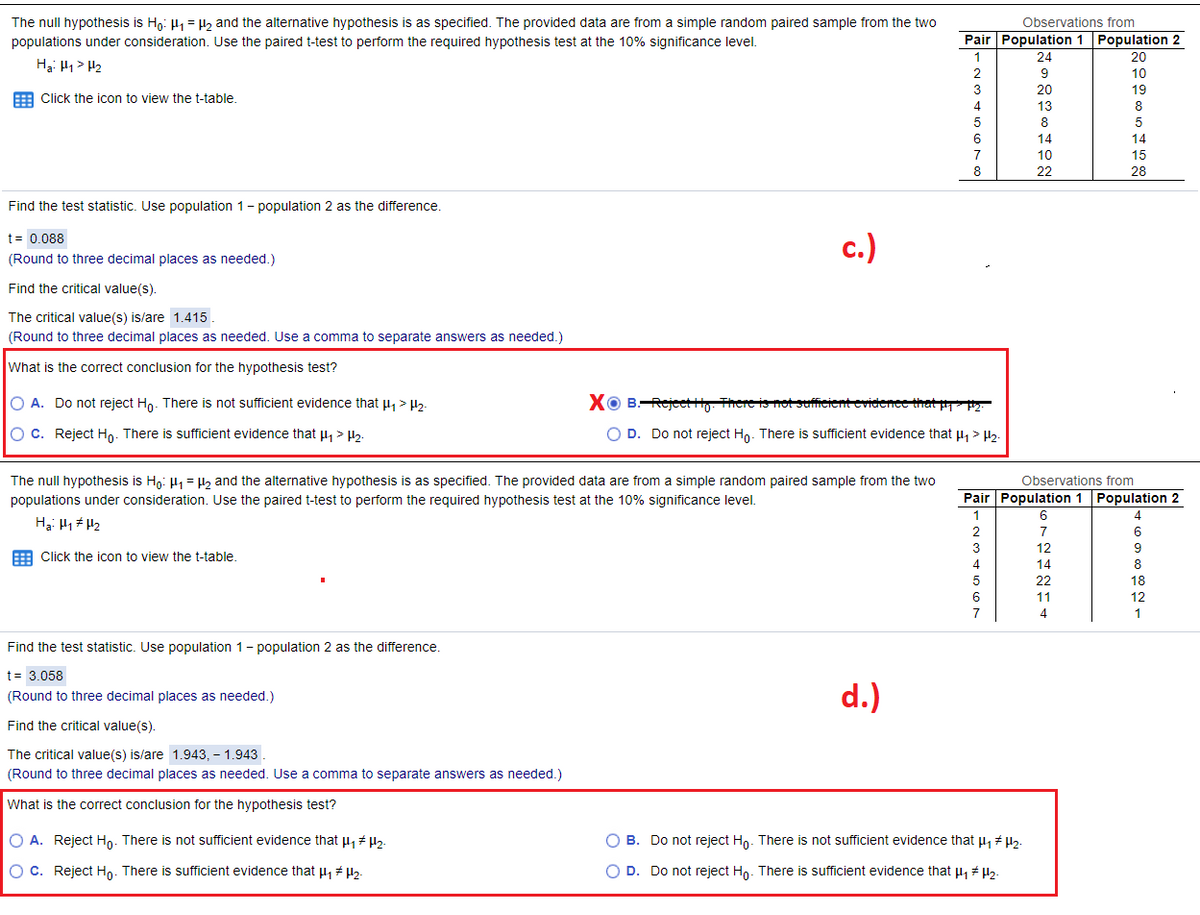
The null hypothesis is Ho: H1 = H, and the alternative hypothesis is as specified. The provided data are from a simple random paired sample from the two
populations under consideration. Use the paired t-test to perform the required hypothesis test at the 10% significance level.
Pair Population 1 Population 2
1
24
2
9
10
3
20
19
E Click the icon to view the t-table.
4
13
8
5
8
14
14
10
15
8
22
28
Find the test statistic. Use population 1- population 2 as the difference.
t= 0.088
c.)
(Round to three decimal places as needed.)
Find the critical value(s).
The critical value(s) is/are 1.415
(Round to three decimal places as needed. Use a comma to separate answers as needed.)
What is the correct conclusion for the hypothesis test?
O A. Do not reject Hn. There is not sufficient evidence that H > 3.
XO B.-Rejeett-
idence that P2
O c. Reject Ho- There is sufficient evidence that p1 > H2.
O D. Do not reject Ho. There is sufficient evidence that µ, > H2.
Observations from
The null hypothesis is H,: H1 = H2 and the alternative hypothesis is as specified. The provided data are from a simple random paired sample from the two
populations under consideration. Use the paired t-test to perform the required hypothesis test at the 10% significance level.
Pair Population 1 Population 2
6.
Hai H1 # H2
2
7
6
12
9
E Click the icon to view the t-table.
4
14
8
22
18
11
12
1
Find the test statistic. Use population 1- population 2 as the difference.
t= 3.058
d.)
(Round to three decimal places as needed.)
Find the critical value(s).
The critical value(s) is/are 1.943, - 1.943
(Round to three decimal places as needed. Use a comma to separate answers as needed.)
What is the correct conclusion for the hypothesis test?
O A. Reject Ho- There
that H, H2-
reject Ho- There is not sufficient
evidence that H # H2:
not sufficient
Do
OC. Reject Ho. There is sufficient evidence that µ, # H2.
O D. Do not reject Hn. There is sufficient evidence that H + H2.

Transcribed Image Text:A scientist investigated the effect of cross-fertilization on the heights of plants. In one study, the scientist planted 15 pairs of a species of plant. Each pair consisted of one cross-fertilized plant and
one self-fertilized plant grown in the same pot. The table available below gives the height differences, in eighths of an inch, for the 15 pairs. Each difference is obtained by subtracting the height of
the self-fertilized plant from that of the cross-fertilized plant. Use the paired t-interval procedure to determine a 99% confidence interval for the difference between the mean heights of
cross-fertilized and self-fertilized plants. Interpret the result. (Note: d = 20.13 and sa = 35.80.)
Click here to view the data, Click here to view a table of critical values oft.
The 99% confidence interval is from - 7.39 eighths of an inch to 47.65 eighths of an inch.
(Round to two decimal places as needed. Use ascending order.)
Which statement below best interprets the confidence interval?
a.)
O A. There is 99% confidence that the difference between the heights of cross-fertilized and self-fertilized plants is in the interval.
O B. There is 99% confidence that the difference between the heights of a cross-fertilized plant and a self-fertilized plant is in the interval.
O C. There is 99% confidence that the difference between the mean heights of cross-fertilized plants and self-fertilized plants is in the interval.
O D. There is 99% confidence that a pair of cross-fertilized and self-fertilized plants has a difference in heights that is in the interval.
Obtain the required confidence interval. Interpret your result.
The accompanying data provide the weights, in pounds, of 17 anorexic women before and after receiving a therapy treatment for anorexia nervosa. Find a 90% confidence interval for the weight
gain that would be obtained, on average, by using the family therapy treatment.
E Click the icon to view the data.
Find the 90% confidence interval. Use Before - After.
- 10.29, - 4.23 ) pounds
b.)
(Round to two decimal places as needed.)
Interpret your result. Choose the correct answer below.
O A. We can be 10% confident that the weight gain that would be obtained, on average, by using the family therapy treatment is somewhere between the endpoints of the confidence interval.
O B. There is a 90% probability that the weight gain that would be obtained by using the family therapy treatment is somewhere between the endpoints of the confidence interval.
O C. Ninety percent of the women gained weight somewhere between the endpoints of the confidence interval.
O D. We can be 90% confident that the weight gain that would be obtained, on average, by using the family therapy treatment is somewhere between the endpoints of the confidence interval.
Expert Solution
This question has been solved!
Explore an expertly crafted, step-by-step solution for a thorough understanding of key concepts.

Step by stepSolved in 4 steps with 4 images

Knowledge Booster


Learn more about
Need a deep-dive on the concept behind this application? Look no further. Learn more about this topic, statistics and related others by exploring similar questions and additional content below.Similar questions
- Hello I need help solving this question, parts b-d thank you!arrow_forwardPlease solve related problems in the attached file. Show every step and do not skip even one step. The right answer is already in the attached file, so I need your steps of solution. THANKS! (PLEASE DO NOT USE HAND-WRITING)arrow_forwardCan you redo the problem? I think the answer for part b should a number between 0 and 1arrow_forward
arrow_back_ios
arrow_forward_ios
Recommended textbooks for you
- MATLAB: An Introduction with ApplicationsStatisticsISBN:9781119256830Author:Amos GilatPublisher:John Wiley & Sons Inc
 Probability and Statistics for Engineering and th...StatisticsISBN:9781305251809Author:Jay L. DevorePublisher:Cengage Learning
 Statistics for The Behavioral Sciences (MindTap C...StatisticsISBN:9781305504912Author:Frederick J Gravetter, Larry B. WallnauPublisher:Cengage Learning
  Elementary Statistics: Picturing the World (7th E...StatisticsISBN:9780134683416Author:Ron Larson, Betsy FarberPublisher:PEARSON
 The Basic Practice of StatisticsStatisticsISBN:9781319042578Author:David S. Moore, William I. Notz, Michael A. FlignerPublisher:W. H. Freeman
 Introduction to the Practice of StatisticsStatisticsISBN:9781319013387Author:David S. Moore, George P. McCabe, Bruce A. CraigPublisher:W. H. Freeman
MATLAB: An Introduction with Applications
Statistics
ISBN:9781119256830
Author:Amos Gilat
Publisher:John Wiley & Sons Inc
Probability and Statistics for Engineering and th...
Statistics
ISBN:9781305251809
Author:Jay L. Devore
Publisher:Cengage Learning
Statistics for The Behavioral Sciences (MindTap C...
Statistics
ISBN:9781305504912
Author:Frederick J Gravetter, Larry B. Wallnau
Publisher:Cengage Learning
Elementary Statistics: Picturing the World (7th E...
Statistics
ISBN:9780134683416
Author:Ron Larson, Betsy Farber
Publisher:PEARSON
The Basic Practice of Statistics
Statistics
ISBN:9781319042578
Author:David S. Moore, William I. Notz, Michael A. Fligner
Publisher:W. H. Freeman
Introduction to the Practice of Statistics
Statistics
ISBN:9781319013387
Author:David S. Moore, George P. McCabe, Bruce A. Craig
Publisher:W. H. Freeman