
MATLAB: An Introduction with Applications
6th Edition
ISBN: 9781119256830
Author: Amos Gilat
Publisher: John Wiley & Sons Inc
expand_more
expand_more
format_list_bulleted
Related questions
Concept explainers
Question
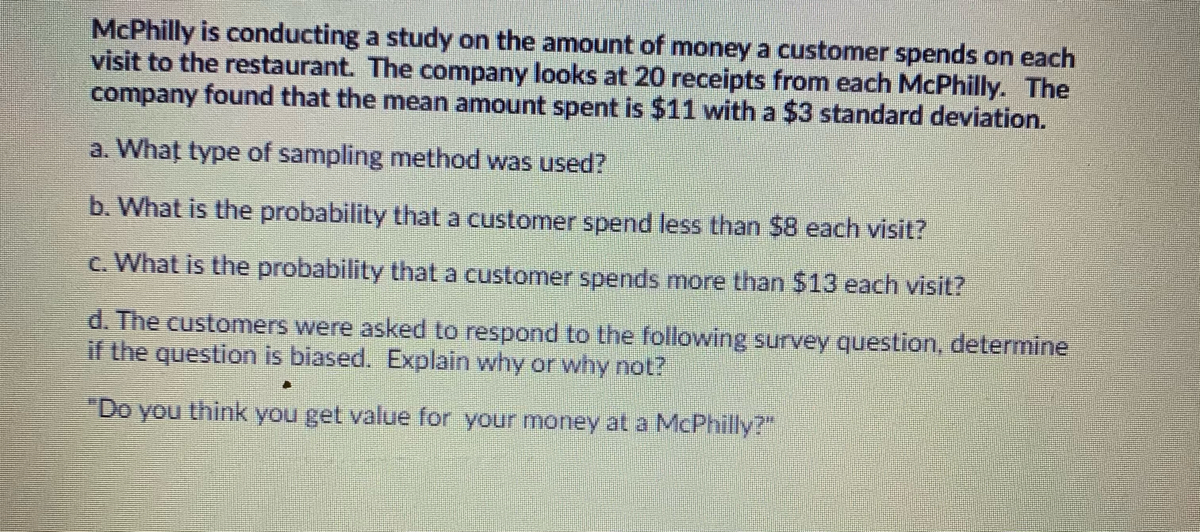

Transcribed Image Text:McPhilly is conducting a study on the amount of money a customer spends on each
visit to the restaurant. The company looks at 20 receipts from each McPhilly. The
company found that the mean amount spent is $11 with a $3 standard deviation.
a. What type of sampling method was used?
b. What is the probability that a customer spend less than $8 each visit?
c. What is the probability that a customer spends more than $13 each visit?
d. The customers were asked to respond to the following survey question, determine
if the question is biased. Explain why or why not?
"Do you think you get value for your money at a McPhilly?"
Expert Solution
This question has been solved!
Explore an expertly crafted, step-by-step solution for a thorough understanding of key concepts.

This is a popular solution

Trending nowThis is a popular solution!

Step by stepSolved in 2 steps with 1 images

Knowledge Booster


Learn more about
Need a deep-dive on the concept behind this application? Look no further. Learn more about this topic, statistics and related others by exploring similar questions and additional content below.Similar questions
- 1. In a sentence or two, explain what a sampling distribution is. 2. In a sentence or two explain how the standard error of the mean is similar to the standard deviation.arrow_forwardThe following data represents the number of blogs that a sample of students state they follow. 12, 3, 10, 9, 0, 1, 8, 7, 3, 10, 19 Calculate the standard deviation.arrow_forwardRefer to the accompanying table, which describes results from groups of 8 births from 8 different sets of parents. The random variable x represents the number of girls among 8 children. Find the mean and standard deviation for the number of girls in 8 births. Click the icon to view the data table. The mean is u = girl(s). (Round to one decimal place as needed.) The standard deviation is o = girl(s). (Round to one decimal place as needed.)arrow_forward
- Find the mean and standard deviation of the number of red-headed Scots in a randomly selected group of 155. The probability of having red hair is still 13% for Scottish people. a. Mean = b. Standard deviation (Round to 2 places)=arrow_forwardPlease don't provide handwritttin solution....arrow_forwardA pollster wants to know the average income of those who supported John McCain for president. He asks 100 supporters and calculates a mean of $67,543. Is this mean x overbar or mu ? A. mu , because it is calculated based off data from the entire population.. B. x overbar , because it is calculated based off data from the entire population. C. mu , because it is calculated based off data from a sample. D. x overbar , because it is calculated based off data from a sample.arrow_forward
- The tourist bureau of the Caribbean Island survey a sample of 6 United States tourists as they left to return home. The tourist was asked how many days they spent on their visits. Their responses were as follows: 11,8,6,12,10,7 find the standard deviation of this sample of numbers.arrow_forwardSuppose six pet food stores in the area were surveyed, and the following data shows how many types of pet food each of them carries. 7,7,9, 9, 11, 11 Calculate the sample mean and the sample standard deviation. Round your answers to three decimal places. T = Number Number S=arrow_forwardBill received the following scores on his quizzes 54, 67, 78, 73, 92, 86, 78, 79, 81, 72 what is the mean, range, standard deviation, mode, median and variance? does the score 54 seem unusual? Why or why not?arrow_forward
- Recently, a random sample of 13–18 year olds was asked, "How much do you currently have in savings?" The data in the table represent the responses to the survey. Approximate the mean and standard deviation amount of savings. LOADING... Click the icon to view the frequency distribution for the amount of savings. Savings Frequency $0– $199 343 $200– $399 94 $400– $599 62 $600– $799 21 $800– $999 9 $1000– $1199 5 $1200– $1399 3 The sample mean amount of savings is $nothing. (Round to the nearest dollar as needed.) The sample standard deviation is $nothing. (Round to the nearest dollar as needed.)arrow_forwardAn insurance company crashed four cars of the same model at 5 miles per hour. The costs of repair for each of the four crashes were $444, $447, $470, and $207 O. Compute the mean, median, and mode cost of repair. Compute the mean cost of repair. Select the correct choice below and, if necessary, fill in the answer box to complete your choice. O A. The mean cost of repair is $ (Round to the nearest cent as needed.) O B. The mean does not exist. Compute the median cost of repair. Select the correct choice below and, if necessary, fill in the answer box to complete your choice. O A. The median cost of repair is $ (Round to the nearest cent as needed.) O B. The median does not exist. Compute the mode cost of repair. Select the correct choice below and, if necessary, fill in the answer box to complete your choice. O A. The mode cost of repair is $ (Round to the nearest cent as needed.) O B. The mode does not exist.arrow_forwardwhat was the age distribution of prehistoric Native America? Extensive , anthropological studies in the southwestern United states gave the following information about a prehistoric extended family group of 82 members on what is now a native american reservation. for this community, estimate the mean age expressed in years, the sample variance, and the sample deviation. For the class 31 and over, use 35.5 as the class midpoint. 39,16, 20,7arrow_forward
arrow_back_ios
arrow_forward_ios
Recommended textbooks for you
- MATLAB: An Introduction with ApplicationsStatisticsISBN:9781119256830Author:Amos GilatPublisher:John Wiley & Sons Inc
 Probability and Statistics for Engineering and th...StatisticsISBN:9781305251809Author:Jay L. DevorePublisher:Cengage Learning
 Statistics for The Behavioral Sciences (MindTap C...StatisticsISBN:9781305504912Author:Frederick J Gravetter, Larry B. WallnauPublisher:Cengage Learning
  Elementary Statistics: Picturing the World (7th E...StatisticsISBN:9780134683416Author:Ron Larson, Betsy FarberPublisher:PEARSON
 The Basic Practice of StatisticsStatisticsISBN:9781319042578Author:David S. Moore, William I. Notz, Michael A. FlignerPublisher:W. H. Freeman
 Introduction to the Practice of StatisticsStatisticsISBN:9781319013387Author:David S. Moore, George P. McCabe, Bruce A. CraigPublisher:W. H. Freeman
MATLAB: An Introduction with Applications
Statistics
ISBN:9781119256830
Author:Amos Gilat
Publisher:John Wiley & Sons Inc
Probability and Statistics for Engineering and th...
Statistics
ISBN:9781305251809
Author:Jay L. Devore
Publisher:Cengage Learning
Statistics for The Behavioral Sciences (MindTap C...
Statistics
ISBN:9781305504912
Author:Frederick J Gravetter, Larry B. Wallnau
Publisher:Cengage Learning
Elementary Statistics: Picturing the World (7th E...
Statistics
ISBN:9780134683416
Author:Ron Larson, Betsy Farber
Publisher:PEARSON
The Basic Practice of Statistics
Statistics
ISBN:9781319042578
Author:David S. Moore, William I. Notz, Michael A. Fligner
Publisher:W. H. Freeman
Introduction to the Practice of Statistics
Statistics
ISBN:9781319013387
Author:David S. Moore, George P. McCabe, Bruce A. Craig
Publisher:W. H. Freeman