
MATLAB: An Introduction with Applications
6th Edition
ISBN: 9781119256830
Author: Amos Gilat
Publisher: John Wiley & Sons Inc
expand_more
expand_more
format_list_bulleted
Related questions
Question
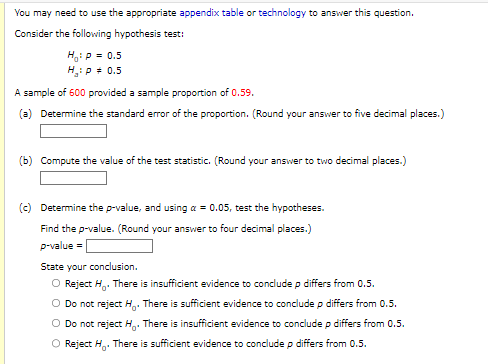

Transcribed Image Text:You may need to use the appropriate appendix table or technology to answer this question.
Consider the following hypothesis test:
H₁: P = 0.5
H₂: P = 0.5
A sample of 600 provided a sample proportion of 0.59.
(a) Determine the standard error of the proportion. (Round your answer to five decimal places.)
(b) Compute the value of the test statistic. (Round your answer to two decimal places.)
(c) Determine the p-value, and using a = 0.05, test the hypotheses.
Find the p-value. (Round your answer to four decimal places.)
p-value =
State your conclusion.
O Reject H. There is insufficient evidence to conclude p differs from 0.5.
O Do not reject Ho. There is sufficient evidence to conclude p differs from 0.5.
O Do not reject H. There is insufficient evidence to conclude p differs from 0.5.
O Reject H. There is sufficient evidence to conclude p differs from 0.5.
Expert Solution
This question has been solved!
Explore an expertly crafted, step-by-step solution for a thorough understanding of key concepts.

This is a popular solution

Trending nowThis is a popular solution!

Step by stepSolved in 5 steps with 12 images

Follow-up Questions
Read through expert solutions to related follow-up questions below.
Follow-up Question
Hello, Can you explain problem c) I do not understand the solution.
Solution
by Bartleby Expert
Follow-up Questions
Read through expert solutions to related follow-up questions below.
Follow-up Question
Hello, Can you explain problem c) I do not understand the solution.
Solution
by Bartleby Expert
Knowledge Booster

Similar questions
- See below. I really need help with this.arrow_forwardYou want to obtain a sample to estimate a population proportion. Based on previous evidence, you believe the population proportion is approximately p = 0.68. You would like to be 97% confident that your estimate is within 2.5% of the true population proportion. How large of sample size is required n =arrow_forwardHow do I find the test statistic and P value for this question?arrow_forward
- Tina catches a 14-pound bass. She does not know the population mean or standard deviation. So she takes a sample of five friends and they say the last bass they caught was 9, 12, 13, 10, and 10 pounds. Find the t and calculate a 95% (α = .05) confidence interval.arrow_forwardA college administrator claims that the proportion of students that are nursing majors is greater than 40%. To test this claim, a group of 400 students are randomly selected and its determined that 190 are nursing majors. The following is the setup for this hypothesis test: Ho : p=0.40 Ha: p > 0.40 Find the test statistic for this hypothesis test for a proportion. Round your answer to 2 decimal places. Provide your answer below: TestStatisticarrow_forwardYou want to obtain a sample to estimate a population mean. Based on previous evidence, you believe the population standard deviation is approximately o = 74.4. You would like to be 90% confident that your estimate is within 4 of the true population mean. How large of a sample size is required? n=arrow_forward
- Need help with #19arrow_forwardYou may need to use the appropriate technology to answer this question. Use the sample data below to test the hypotheses Ho:P1 = P2 = P3 H3i not all population proportions are equal where p, is the population proportion of Yes responses for population i. Populations Response 1 3 Yes 140 150 106 No 90 150 114 Find the value of the test statistic. (Round your answer to three decimal places.) Find the p-value. (Round your answer to four decimal places.) p-value Using a 0.05 level of significance, state your conclusion. O Do not reject Ho. We conclude that not all population proportions are equal. Do not reject Ho: We cannot conclude that not all population proportions are equal. Reject Ho. We conclude that not all population proportions are equal. O Reject Ho: We cannot conclude that not all population proportions are equal.arrow_forwardWe want to conduct a hypothesis test of the claim that for middle-aged adults the population mean of their cholesterol levels is less than 191.7 mg dL mg dL mg a random sample of such levels. The sample has a mean of 190.7 dL -0 O It is unclear which test statistic to use. For each of the following sampling scenarios, choose an appropriate test statistic for our hypothesis test on the population mean. Then calculate that statistic. Round your answers to two decimal places. (a) The sample has size 110, and it is from a non-normally distributed population with a known standard deviation of 19.1. Oz = 0t= (b) The sample has size 14, and it is from a population with a distribution about which we know very little. 2-0 Oz= 01-0 O It is unclear which test statistic to use. and a standard deviation of 18 Explanation Check . We choos X Ⓒ2022 McGraw Hill LLC. All Rights Reserved. Terms of Use | Privacy Cerarrow_forward
arrow_back_ios
arrow_forward_ios
Recommended textbooks for you
- MATLAB: An Introduction with ApplicationsStatisticsISBN:9781119256830Author:Amos GilatPublisher:John Wiley & Sons Inc
 Probability and Statistics for Engineering and th...StatisticsISBN:9781305251809Author:Jay L. DevorePublisher:Cengage Learning
 Statistics for The Behavioral Sciences (MindTap C...StatisticsISBN:9781305504912Author:Frederick J Gravetter, Larry B. WallnauPublisher:Cengage Learning
  Elementary Statistics: Picturing the World (7th E...StatisticsISBN:9780134683416Author:Ron Larson, Betsy FarberPublisher:PEARSON
 The Basic Practice of StatisticsStatisticsISBN:9781319042578Author:David S. Moore, William I. Notz, Michael A. FlignerPublisher:W. H. Freeman
 Introduction to the Practice of StatisticsStatisticsISBN:9781319013387Author:David S. Moore, George P. McCabe, Bruce A. CraigPublisher:W. H. Freeman
MATLAB: An Introduction with Applications
Statistics
ISBN:9781119256830
Author:Amos Gilat
Publisher:John Wiley & Sons Inc
Probability and Statistics for Engineering and th...
Statistics
ISBN:9781305251809
Author:Jay L. Devore
Publisher:Cengage Learning
Statistics for The Behavioral Sciences (MindTap C...
Statistics
ISBN:9781305504912
Author:Frederick J Gravetter, Larry B. Wallnau
Publisher:Cengage Learning
Elementary Statistics: Picturing the World (7th E...
Statistics
ISBN:9780134683416
Author:Ron Larson, Betsy Farber
Publisher:PEARSON
The Basic Practice of Statistics
Statistics
ISBN:9781319042578
Author:David S. Moore, William I. Notz, Michael A. Fligner
Publisher:W. H. Freeman
Introduction to the Practice of Statistics
Statistics
ISBN:9781319013387
Author:David S. Moore, George P. McCabe, Bruce A. Craig
Publisher:W. H. Freeman