MATLAB: An Introduction with Applications
6th Edition
ISBN: 9781119256830
Author: Amos Gilat
Publisher: John Wiley & Sons Inc
expand_more
expand_more
format_list_bulleted
Question

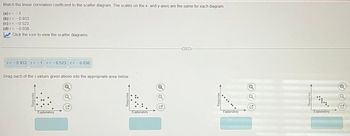
Transcribed Image Text:Match the linear correlation coefficient to the scatter diagram. The scales on the x- and y-axes are the same for each diagram.
(a) r = -1
(b) r= -0.933
(c) r=-0.523
(d) r= -0.038
Click the icon to view the scatter diagrams.
r= -0.933 r= -1 r= -0.523 r=-0.038
Drag each of the r-values given above into the appropriate area below.
Q
Response
Explanatory
Response
Explanatory
Q
***
Response
Explanatory
Q
Response
Explanatory
Expert Solution
This question has been solved!
Explore an expertly crafted, step-by-step solution for a thorough understanding of key concepts.
This is a popular solution
Trending nowThis is a popular solution!
Step by stepSolved in 3 steps

Knowledge Booster
Similar questions
- The accompanying data were read from graphs that appeared in an article. The variables shown are the number of acres burned in forest fires in the western United States and timber sales. (Note: the data is the image) (a) Compute the correlation coefficient. (Give the answer to three decimal places.) r=? I need the answer for "r"arrow_forwardy 6 4 2 0 0 2 4 6 8 x Tell whether the data have a positive correlation, a negative correlation, or approximately no correlation.arrow_forwardYou generate a scatter plot using Excel. You then have Excel plot the trend line and report the equation and the r2 value. The regression equation is reported as y = - 61.46x + 41.55 and the r? = 0.16. What is the correlation coefficient for this data set? r =arrow_forward
- The table shows the number of absences, x, in a class and the final exam grade, y, for seven students. X 1 0 2 6 4 3 3 Y 95 90 90 55 70 80 85 Use the graphing calculator to find the correlation coefficient. (Round answer to three decimal places. Do not write 0.123 as.123.)arrow_forwardThe following data were collected. x 35 39 42 45 56 y 17 19 25 27 30 write an equation that models the data. ŷ = 0.631x − 3.791 ŷ = 3.791x + 0.631 ŷ = −0.631x + 3.791 ŷ = −3.791x − 0.631arrow_forwardYou generate a scatter plot using Excel. You then have Excel plot the trend line and report the equation and the r value. The regression equation is reported as y = 75.56z + 78.71 and the r = 0.2209. What is the correlation coefficient for this data set?arrow_forward
- Match the correlation coefficients with their scatterplots. Select the letter of the scatterplot below which corresponds to the correlation coefficient. (Click on image for a larger view.) B v 1. r = -0.74 с A ✓ 2. r = -0.49 3. r = -0.97 4. r = 0.76 A B Darrow_forwardYou generate a scatter plot using Excel. You then have Excel plot the trend line and report the equation and the r value. The regression equation is reported as y = – 17.55x + 59.45 and the r? = 0.0081. What is the correlation coefficient for this data set? r =arrow_forwardMatch the coefficient of determination to the scatter diagram. The scales on the x-axis and y-axis are the same for each scatter diagram. (a) R2=0.12, (b) R2=0.90, (a) Scatter diagram . (b) Scatter diagram . (c) Scatter diagramarrow_forward
arrow_back_ios
SEE MORE QUESTIONS
arrow_forward_ios
Recommended textbooks for you
 MATLAB: An Introduction with ApplicationsStatisticsISBN:9781119256830Author:Amos GilatPublisher:John Wiley & Sons Inc
 Probability and Statistics for Engineering and th...StatisticsISBN:9781305251809Author:Jay L. DevorePublisher:Cengage Learning
 Statistics for The Behavioral Sciences (MindTap C...StatisticsISBN:9781305504912Author:Frederick J Gravetter, Larry B. WallnauPublisher:Cengage Learning
 Elementary Statistics: Picturing the World (7th E...StatisticsISBN:9780134683416Author:Ron Larson, Betsy FarberPublisher:PEARSON
 The Basic Practice of StatisticsStatisticsISBN:9781319042578Author:David S. Moore, William I. Notz, Michael A. FlignerPublisher:W. H. Freeman
 Introduction to the Practice of StatisticsStatisticsISBN:9781319013387Author:David S. Moore, George P. McCabe, Bruce A. CraigPublisher:W. H. Freeman

MATLAB: An Introduction with Applications
Statistics
ISBN:9781119256830
Author:Amos Gilat
Publisher:John Wiley & Sons Inc

Probability and Statistics for Engineering and th...
Statistics
ISBN:9781305251809
Author:Jay L. Devore
Publisher:Cengage Learning

Statistics for The Behavioral Sciences (MindTap C...
Statistics
ISBN:9781305504912
Author:Frederick J Gravetter, Larry B. Wallnau
Publisher:Cengage Learning

Elementary Statistics: Picturing the World (7th E...
Statistics
ISBN:9780134683416
Author:Ron Larson, Betsy Farber
Publisher:PEARSON

The Basic Practice of Statistics
Statistics
ISBN:9781319042578
Author:David S. Moore, William I. Notz, Michael A. Fligner
Publisher:W. H. Freeman

Introduction to the Practice of Statistics
Statistics
ISBN:9781319013387
Author:David S. Moore, George P. McCabe, Bruce A. Craig
Publisher:W. H. Freeman