
MATLAB: An Introduction with Applications
6th Edition
ISBN: 9781119256830
Author: Amos Gilat
Publisher: John Wiley & Sons Inc
expand_more
expand_more
format_list_bulleted
Related questions
Concept explainers
Question
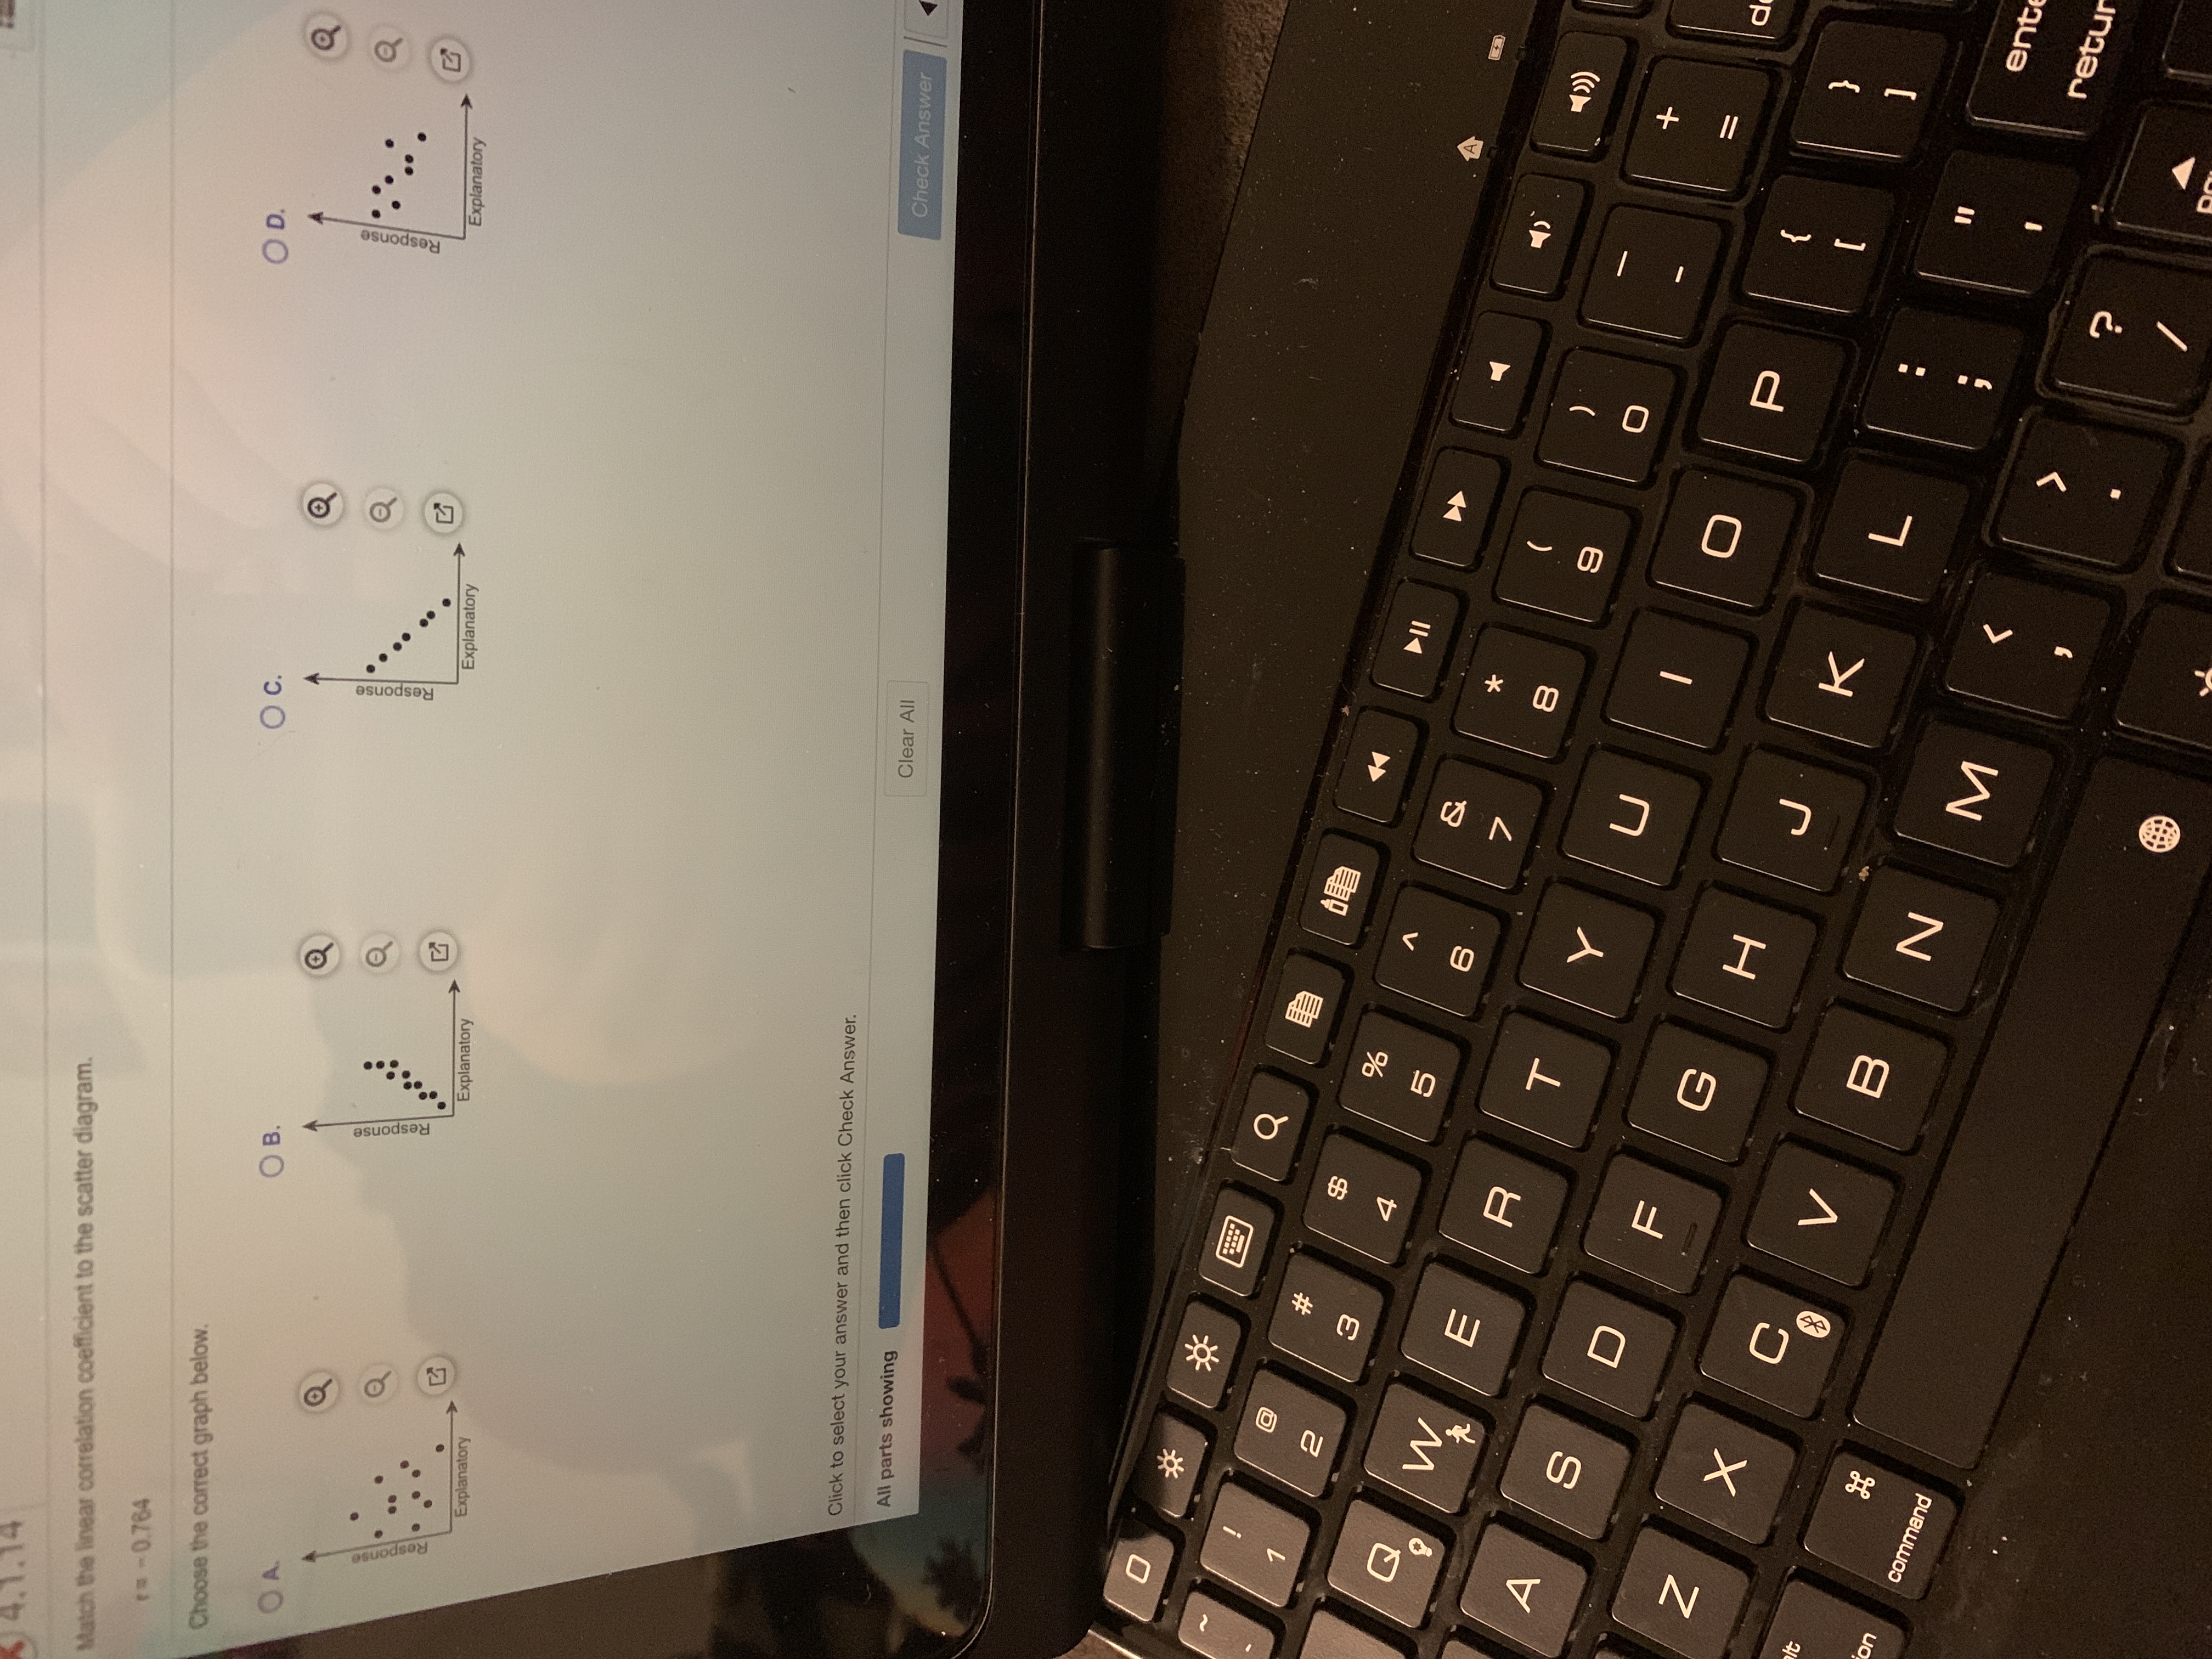

Transcribed Image Text:The task is to match the linear correlation coefficient to the scatter diagram. The given correlation coefficient is -0.784. Four scatter plot options are provided to choose from, labeled as A, B, C, and D.
**Scatter Plot A:**
- Displays a downward trend with a cluster of points that generally move from the upper left to the lower right.
- Suggests a possible negative correlation.
**Scatter Plot B:**
- Points show an upward linear trend, moving from the lower left to the upper right.
- Indicates a positive correlation.
**Scatter Plot C:**
- Exhibits a clear downward trend with closely grouped points, moving from top left to bottom right.
- Strongly suggests a negative correlation, potentially a match for -0.784.
**Scatter Plot D:**
- Points are scattered, with a general downward trend, but less clustered than C.
- Suggests a weaker negative correlation.
To submit your answer, use the checkbox next to each option and then click the "Check Answer" button.
(Note: Choose the graph that best fits the correlation coefficient of -0.784, which would likely be Scatter Plot C due to its clear strong negative correlation.)
Expert Solution
This question has been solved!
Explore an expertly crafted, step-by-step solution for a thorough understanding of key concepts.

This is a popular solution

Trending nowThis is a popular solution!

Step by stepSolved in 2 steps

Knowledge Booster


Learn more about
Need a deep-dive on the concept behind this application? Look no further. Learn more about this topic, statistics and related others by exploring similar questions and additional content below.Similar questions
- A scatterplot of two variables is a picture of the relationship represented in a correlation. Group of answer choices True Falsearrow_forwardDistinguish the correlation shown in the graph below. Summarize why it is the chosen correlation. 30 Use the paperclip button below to attach files. Student can enter max 3000 characters 1- XD 2= DELL to B I U 25 de 2arrow_forwardWhich r is the strongest correlation? O -0.8 O-0.18 O-0.09 O 0.711 O 0.4arrow_forward
- Assume that you have paired values consisting of heights (in inches) and weights (in lb) from 40 randomly selected men. The linear correlation coefficient r is 0.567. Find the value of the coefficient of determination. What practical information does the coefficient of determination provide? Question content area bottom Part 1 Choose the correct answer below. A. The coefficient of determination is 0.321. 32.1% of the variation is explained by the linear correlation, and 67.9% is explained by other factors. B. The coefficient of determination is 0.679. 67.9% of the variation is explained by the linear correlation, and 32.1% is explained by other factors. C. The coefficient of determination is 0.321. 67.9% of the variation is explained by the linear correlation, and 32.1% is explained by other factors. D. The coefficient of determination is 0.679. 32.1% of the variation is explained by the linear correlation, and 67.9% is…arrow_forwardHelp pleasearrow_forwardThe table shows… coefficient correlationarrow_forward
- 42arrow_forwardNEW STUDY: A researcher is interested in the relationship between levels of stress at work and self-reports of overall health. Stress at work is measured on a scale from 0 (no stress at work) to 100 (extreme levels of stress at work). The researcher conducts a study with 11 subjects and determines that the relationship between self-reports of stress and self-reports of overall heath is r = -.41. Which test was conducted for this study? Group of answer choices z-test t-test correlation chi-squarearrow_forwardWhat is a reason why correlation does not imply causation? O Because correlations are not based on data. O Because you do not know if X or Y occurred first. O There could be a third variable that explains both X and Y. O Both b and carrow_forward
- Find the correlation coefficient for the data set below. x 3, 5, 6, 7, 9 y 5, 1, 9, 7, 13arrow_forwardK Refer to the accompanying scatterplot. The four points in the lower left corner are measurements from women, and the four points in the upper right corner are from men. Complete parts (a) through (e) below. OA. There appears to be a linear correlation because the points form a line. OB. There appears to be a linear correlation because the points form an obvious pattern. OC. There does not appear to be a linear correlation because the points do not form a line. O D. There does not appear to be a linear correlation because the points form an obvious pattern. AY OA. There appears to be a linear correlation because the points form an obvious pattern. OB. There appears to be a linear correlation because the points form a line. OC. There does not appear to be a linear correlation because the points form an obvious pattern. OD. There does not appear to be a linear correlation because the points do not form a line. 12- 9- 0 The correlation coefficient for the points in the lower left corner…arrow_forwardA, B, C, or D?arrow_forward
arrow_back_ios
arrow_forward_ios
Recommended textbooks for you
- MATLAB: An Introduction with ApplicationsStatisticsISBN:9781119256830Author:Amos GilatPublisher:John Wiley & Sons Inc
 Probability and Statistics for Engineering and th...StatisticsISBN:9781305251809Author:Jay L. DevorePublisher:Cengage Learning
 Statistics for The Behavioral Sciences (MindTap C...StatisticsISBN:9781305504912Author:Frederick J Gravetter, Larry B. WallnauPublisher:Cengage Learning
  Elementary Statistics: Picturing the World (7th E...StatisticsISBN:9780134683416Author:Ron Larson, Betsy FarberPublisher:PEARSON
 The Basic Practice of StatisticsStatisticsISBN:9781319042578Author:David S. Moore, William I. Notz, Michael A. FlignerPublisher:W. H. Freeman
 Introduction to the Practice of StatisticsStatisticsISBN:9781319013387Author:David S. Moore, George P. McCabe, Bruce A. CraigPublisher:W. H. Freeman
MATLAB: An Introduction with Applications
Statistics
ISBN:9781119256830
Author:Amos Gilat
Publisher:John Wiley & Sons Inc
Probability and Statistics for Engineering and th...
Statistics
ISBN:9781305251809
Author:Jay L. Devore
Publisher:Cengage Learning
Statistics for The Behavioral Sciences (MindTap C...
Statistics
ISBN:9781305504912
Author:Frederick J Gravetter, Larry B. Wallnau
Publisher:Cengage Learning
Elementary Statistics: Picturing the World (7th E...
Statistics
ISBN:9780134683416
Author:Ron Larson, Betsy Farber
Publisher:PEARSON
The Basic Practice of Statistics
Statistics
ISBN:9781319042578
Author:David S. Moore, William I. Notz, Michael A. Fligner
Publisher:W. H. Freeman
Introduction to the Practice of Statistics
Statistics
ISBN:9781319013387
Author:David S. Moore, George P. McCabe, Bruce A. Craig
Publisher:W. H. Freeman