
MATLAB: An Introduction with Applications
6th Edition
ISBN: 9781119256830
Author: Amos Gilat
Publisher: John Wiley & Sons Inc
expand_more
expand_more
format_list_bulleted
Related questions
Concept explainers
Topic Video
Question
Match the degrees of freedom to its possible graph of the χ2 distribution. Not all choices are selected.
Graph #1, #2, #3 (see attached)
Options (to select from):
- 50
- 300
- 10
- 3
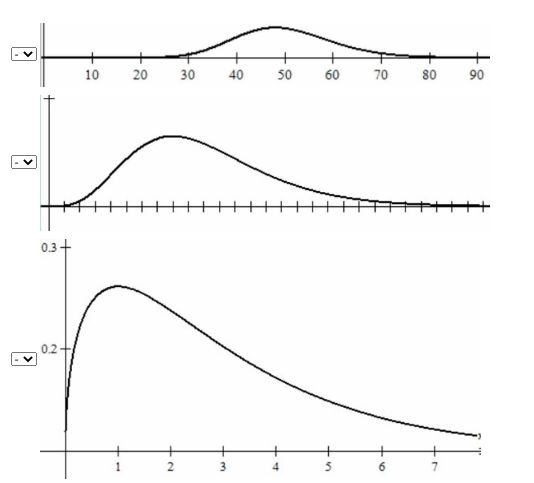

Transcribed Image Text:The image contains three graphs, each depicting a different probability distribution.
1. **Graph 1 (Top Graph): Normal Distribution**
- This graph represents a normal distribution, also known as a Gaussian distribution, often referred to as a bell curve due to its shape.
- The x-axis ranges from 0 to 90, with a peak around the middle (approximately 50), indicating the mean of the distribution.
- The curve is symmetrical around the mean, and the tails approach the x-axis but never touch it.
2. **Graph 2 (Middle Graph): Log-Normal Distribution**
- This graph displays a log-normal distribution.
- The x-axis is marked with tick marks, and the curve is skewed to the right, indicating that this distribution is not symmetric.
- The peak is located towards the left side, with a long tail extending to the right.
- This distribution is often used in statistics to model variables that are positively skewed.
3. **Graph 3 (Bottom Graph): Gamma Distribution**
- The final graph depicts a gamma distribution.
- The x-axis ranges from 0 to 8, with values increasing to 0.3 on the y-axis.
- The curve rises sharply to a peak at around 1, then gradually declines as it moves to the right, indicating a right-skewed distribution.
- The gamma distribution is commonly used to model wait times and is characterized by its shape (α parameter) and scale (β parameter).
These graphs illustrate three different types of probability distributions, each with unique characteristics used to model various statistical phenomena.
Expert Solution
This question has been solved!
Explore an expertly crafted, step-by-step solution for a thorough understanding of key concepts.

This is a popular solution

Trending nowThis is a popular solution!

Step by stepSolved in 3 steps with 3 images

Knowledge Booster


Learn more about
Need a deep-dive on the concept behind this application? Look no further. Learn more about this topic, statistics and related others by exploring similar questions and additional content below.Similar questions
- there are two bags each containing 50 marbles. In one of the bags, 80% of the marbles are red and 20% are black. In the other bag 40% of the marbles are red and 60% are black. students took random samples of 10 marbles from each bag (replacing the marbles after every sample) and made the dot plots shown next. for each of the following questions answer the question (to the extent possible) and determine the graph reading level of the question. explain your reasoning. a. how many random samples were taken from bag 1? how many random samples were taken from bag 2? b. from which bag were more random samples that contained exactly 5 red marbles taken? c. did any of the random samples have exactly 8 black marbles? d. how many random samples from bag 1 had exactly 8 red marbles? how many random samples from bag 2 had exactly 8 red marbles? e. what percent of the random samples from bag 1 had between 30% and 50% red marbles? what percent of the random samples from bag 20 had between 30% and…arrow_forwardesc Based on the given graph, are there any outliers in the data? 300 1 q a alt O 340 380 420 460 Battery Life (minutes) No outliers at least one upper outlier at least one lower outlier cannot be determined Z 2 W S # 3 x e d $ 4 r % 5 C f t JU Dil g y & 8arrow_forwardGive a brief analysis on the graph given in the picture by using the data (Dominant behaviors of reisdent male towards female and male intruder)arrow_forward
- how do you work a,b, and C? Thanks!arrow_forward#mylab pearson.com Student/Player Test aspectostid-2483556348centerwin-yes Explore KnightCo... UCF OUTLOOK UCF canvas 2023 Online - Spring 2023 list 4 K OA. Construct a scatterplot. Choose the correct graph below. 200- 160 160 200 Handshake President's height Q Knightline The table provided below shows paired data for the heights of a certain country's presidents and their main opponents in the election campaign Construct a scatterplot Does there appear to be a comelation? Click the icon to view the data table for election heights. 200- Q Search 160- Home - Netflix 200 President's height 160 m HBO Max Does there appear to be a correlation between the president's height and his opponent's height? L Disney+ | Movies a... 36 SKY-OU O. C. 200- OA. Yes, there appears to be a correlation. As the president's height increases, his opponent's height increases. OB. Yes, there appears to be a correlation. As the president's height increases, his opponent's height decreases. OC. Yes, there appears…arrow_forwardN AaBbCcDc AaBbCcDc AaBbCc AABBCCC AaB O Find Replace 三、 、田、 1 Normal T No Spac... Heading 1 Heading 2 Title A Select v graph Styles Editing 11. A school newspaper reporter decides to randomly survey 18 students to see if they will attend Tet (Vietnamese New Year) festivities this year. Based on past years, she knows that 16% of students attend Tet festivities. We are interested in the number of students who will attend the festivities. Find the probability that at most 3 students will attend. (Round your answer to four decimal places.)arrow_forward
- Drag the correct classification for each graph into the boxes to complete the table. Graphs of Classification Functions 1. 1. 1. Activate Windows Go to Settings to actvate WWindcarrow_forwardSelect an appropriate graph to present the data in the table below. Briefly explain yourgraph highlighting the keys points between 2019 and 2020 (Hint: Use MS Excel to producethe selected graph). All arrivals to Australia in April 2019 and in April2020Country of citizenship Apr-19 Apr-20New Zealand 163,130 1,180India 53,450 990UK 83,960 530Philippines 23,070 360China 132,360 320Pakistan 4,780 280Indonesia 17,870 270Germany 17,900 220Malaysia 36,670 220USA 63,270 200SourceAustralian Bureau ofStatisticsarrow_forwardSelect an appropriate graph to present the data in the table below. Briefly explain yourgraph highlighting the keys points between 2019 and 2020 (Hint: Use MS Excel to producethe selected graph).All arrivals to Australia in April 2019 and in April2020Country of citizenship Apr-19 Apr-20New Zealand 163,130 1,180India 53,450 990UK 83,960 530Philippines 23,070 360China 132,360 320Pakistan 4,780 280Indonesia 17,870 270Germany 17,900 220Malaysia 36,670 220USA 63,270 200SourceAustralian Bureau ofStatisticsb) Briefly explain the meaning of the following terms. Provide at least one relevant example.• Central limit theorem• Confidence interval• Confidence level• Interval estimate• Point estimatearrow_forward
arrow_back_ios
arrow_forward_ios
Recommended textbooks for you
- MATLAB: An Introduction with ApplicationsStatisticsISBN:9781119256830Author:Amos GilatPublisher:John Wiley & Sons Inc
 Probability and Statistics for Engineering and th...StatisticsISBN:9781305251809Author:Jay L. DevorePublisher:Cengage Learning
 Statistics for The Behavioral Sciences (MindTap C...StatisticsISBN:9781305504912Author:Frederick J Gravetter, Larry B. WallnauPublisher:Cengage Learning
  Elementary Statistics: Picturing the World (7th E...StatisticsISBN:9780134683416Author:Ron Larson, Betsy FarberPublisher:PEARSON
 The Basic Practice of StatisticsStatisticsISBN:9781319042578Author:David S. Moore, William I. Notz, Michael A. FlignerPublisher:W. H. Freeman
 Introduction to the Practice of StatisticsStatisticsISBN:9781319013387Author:David S. Moore, George P. McCabe, Bruce A. CraigPublisher:W. H. Freeman
MATLAB: An Introduction with Applications
Statistics
ISBN:9781119256830
Author:Amos Gilat
Publisher:John Wiley & Sons Inc
Probability and Statistics for Engineering and th...
Statistics
ISBN:9781305251809
Author:Jay L. Devore
Publisher:Cengage Learning
Statistics for The Behavioral Sciences (MindTap C...
Statistics
ISBN:9781305504912
Author:Frederick J Gravetter, Larry B. Wallnau
Publisher:Cengage Learning
Elementary Statistics: Picturing the World (7th E...
Statistics
ISBN:9780134683416
Author:Ron Larson, Betsy Farber
Publisher:PEARSON
The Basic Practice of Statistics
Statistics
ISBN:9781319042578
Author:David S. Moore, William I. Notz, Michael A. Fligner
Publisher:W. H. Freeman
Introduction to the Practice of Statistics
Statistics
ISBN:9781319013387
Author:David S. Moore, George P. McCabe, Bruce A. Craig
Publisher:W. H. Freeman