
MATLAB: An Introduction with Applications
6th Edition
ISBN: 9781119256830
Author: Amos Gilat
Publisher: John Wiley & Sons Inc
expand_more
expand_more
format_list_bulleted
Related questions
Question
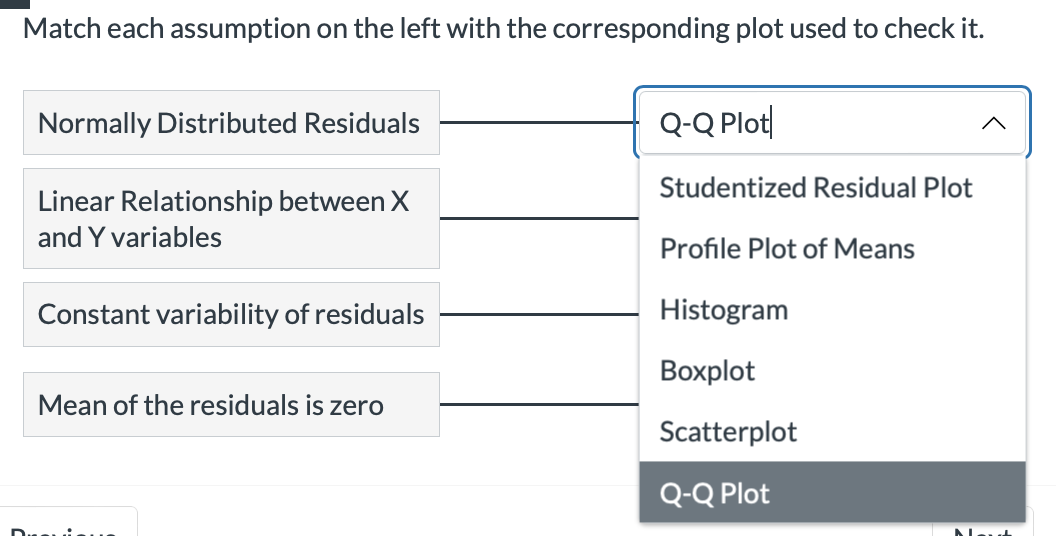

Transcribed Image Text:Match each assumption on the left with the corresponding plot used to check it.
Normally Distributed Residuals
Linear Relationship between X
and Y variables
Constant variability of residuals
Mean of the residuals is zero
Q-Q Plot
Studentized Residual Plot
Profile Plot of Means
Histogram
Boxplot
Scatterplot
Q-Q Plot
Expert Solution
This question has been solved!
Explore an expertly crafted, step-by-step solution for a thorough understanding of key concepts.

This is a popular solution

Trending nowThis is a popular solution!

Step by stepSolved in 2 steps

Knowledge Booster

Similar questions
- The __________ __ __ ______ of a random sample is the graph of its theoretical normal percentiles paired with corresponding actual percentiles of the random sample. A. scatterplot B. normal q-q plot C. fitted histogram D. unbiased estimatorarrow_forwardPLEASE HELP!!!arrow_forwardThe parallel trends assumption is a crucial assumption for which the following estimators? Multiple regression Differences-in-Differences First differences Instrumental Variablearrow_forward
- A correlation near 0 indicates: Group of answer choices There is no relationship between variables There is a perfect linear relationship between variables There could be no relationship between variables or there could be a relationship that is no linear There are outliers in the data setarrow_forwardThe weights of bags of baby carrots are normally distributed, with a mean of 29 ounces and a standard deviation of 0.34 ounce. Bags in the upper 4.5% are too heavy and must be repackaged. What is the most a bag of baby carrots can weigh and not need to be repackaged? A bag of baby carrots can weigh at most______ ounces without needing to be repackaged. (Round to two decimal places as needed.)arrow_forwardLINEAR CORRELATION PROJECT / Topic: Does per capita income affect birth rates I need help with the trendline, the hypothesis, and conclusion, any confounding variables there might be and the r- value, and compare the r-value to the appropriate cutoff value, with correct interpretation. (remember for a sample size of 20, the absolute value of r should be greater than 0.45) The regression equation is: y=21.129−0.108xwhere y: average birth rate and x: per capita incomey and x is negatively related i.e with increase in x , y decreses and vice versa ((* for a sample size of 20, the absolute value of r should be greater than 0.45)) Country Per Capita Income Average Birth Rate Afghanistan $ 530 37.9 Austria $ 51,460 9.5 Cambodia $ 1,530 23 Canada $ 46,370 10.3 Denmark $ 63,950 10.5 Ecuador $ 6,090 17.9 Ethiopia $…arrow_forward
arrow_back_ios
arrow_forward_ios
Recommended textbooks for you
- MATLAB: An Introduction with ApplicationsStatisticsISBN:9781119256830Author:Amos GilatPublisher:John Wiley & Sons Inc
 Probability and Statistics for Engineering and th...StatisticsISBN:9781305251809Author:Jay L. DevorePublisher:Cengage Learning
 Statistics for The Behavioral Sciences (MindTap C...StatisticsISBN:9781305504912Author:Frederick J Gravetter, Larry B. WallnauPublisher:Cengage Learning
  Elementary Statistics: Picturing the World (7th E...StatisticsISBN:9780134683416Author:Ron Larson, Betsy FarberPublisher:PEARSON
 The Basic Practice of StatisticsStatisticsISBN:9781319042578Author:David S. Moore, William I. Notz, Michael A. FlignerPublisher:W. H. Freeman
 Introduction to the Practice of StatisticsStatisticsISBN:9781319013387Author:David S. Moore, George P. McCabe, Bruce A. CraigPublisher:W. H. Freeman
MATLAB: An Introduction with Applications
Statistics
ISBN:9781119256830
Author:Amos Gilat
Publisher:John Wiley & Sons Inc
Probability and Statistics for Engineering and th...
Statistics
ISBN:9781305251809
Author:Jay L. Devore
Publisher:Cengage Learning
Statistics for The Behavioral Sciences (MindTap C...
Statistics
ISBN:9781305504912
Author:Frederick J Gravetter, Larry B. Wallnau
Publisher:Cengage Learning
Elementary Statistics: Picturing the World (7th E...
Statistics
ISBN:9780134683416
Author:Ron Larson, Betsy Farber
Publisher:PEARSON
The Basic Practice of Statistics
Statistics
ISBN:9781319042578
Author:David S. Moore, William I. Notz, Michael A. Fligner
Publisher:W. H. Freeman
Introduction to the Practice of Statistics
Statistics
ISBN:9781319013387
Author:David S. Moore, George P. McCabe, Bruce A. Craig
Publisher:W. H. Freeman